Tutorials
Table of Contents
Overview
This section provides tutorials and/or additional information for various components available within the NOAA/CIMSS Volcanic Cloud Monitoring Website. Many of the links contained within this section are linked to from various places through the website, but organizing them into a single, easy to navigate page is provided for users desiring more information or for users not familar with all products.
Frequently Asked Questions
Imagery/Alert Interpretation
- What satellites are currently processed?
Geostationary: GOES-EAST, GOES-WEST, SEVIRI, and MTSAT.
Low-Earth Orbit: MODIS (Aqua and Terra), VIIRS
This list will be updated as sensors are added (AVHRR, ABI, AHI, etc.) - With what latency are alerts produced? The data latency varies depending upon sensor and method for data acquistition. Each alert contains a production date/time stamp, which allows a user to infer latency. In general, data latency is 5-30 minutes for geostationary satellites, 20-40 minutes for direct broadcast polar satellites, and 1-4 hours for MODIS data obtained via NASA LANCE Rapid Response Near Real Time feed. See Coverage Map for sectorized global coverage.
- I do not receive alerts when a volcanic cloud is indicated on the satellite imagery loops, why? The NOAA/CIMSS alert system maintains knowledge of existing volcanic ash clouds, volcanic thermal anomalies, etc. The system is designed to NOT repeat alerts with each new image--sufficient time must pass before another alert is triggered or significant change in the alerted feature must occur (e.g., sudden increase of retrieved ash cloud height).
Subscription Services
- My wireless provider is not listed in the drop down menu, what should I do? Only US and Canada providers are currently supported. If your US or Canada wireless provider is not listed please contact us.
- My text message alerts were working but I suddenly stopped receiving text alerts, what is wrong? Please review your SMS subscription information, has your wireless number changed? Has your provider changed? If your provider has changed you must re-select your new provider as each provider has unique SMS information.
False Color Imagery
False color or multi-spectral imagery is a imaging technique used to include multiple pieces of information (in these images, spectral information) in one image. The resultant colors of specific phenomona within false color imagery generally appear in a specific color or color range. For example, volcanic ash and dust will often have a magent/pink color in the false color imagery discussed below.
False Color Imagery Basics
Multispectral imagery uses different spectral information displayed as 256 shades of three colors, typically red, green, and blue. The combination of 256 shades of red, green, and blue into a single image total 16,777,216 possible color combinations in multispectral imagery, also known as 24-bit color. One example of 24-bit color images many are familiar with is true color imagery, in which satellite observations in the red, green, and blue visible bands are combined to create an image that looks just how a human sees it (grass is green, water is dark blue, sand is tan, clouds are white, etc.). False color imagery is analogous to true color imagery, except spectral observations outside of the visible spectra are often used. The example below illustrates how a false color image is created via the red, green, and blue components.
Consider a brightness temperature difference image traditionally used in volcanic cloud monitoring, the split-window (12 um – 11 um) with a gray scale enhancement:
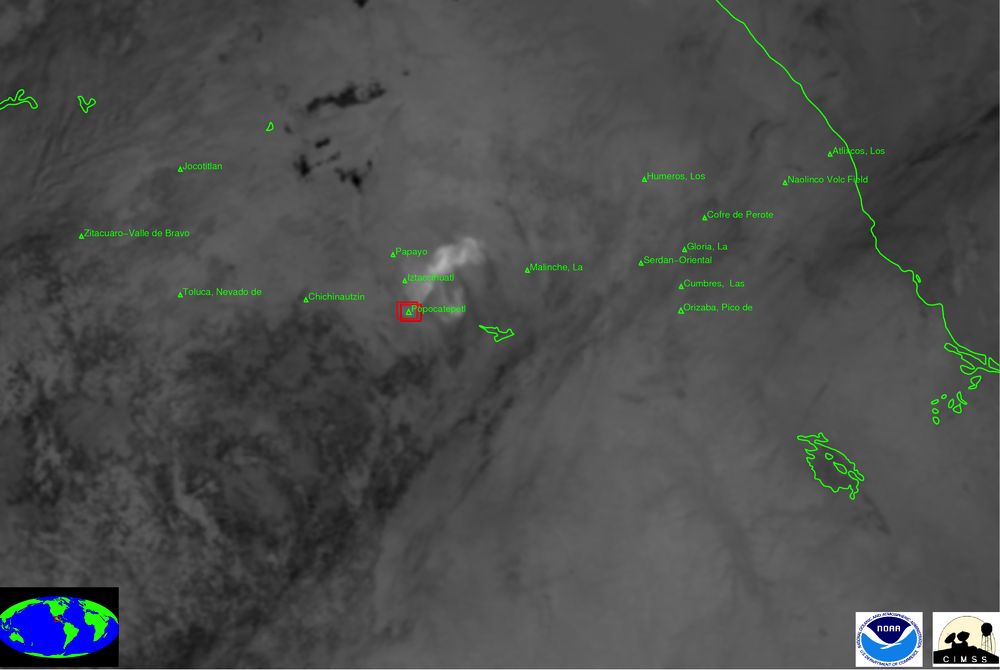 Split-window image (12 um - 11 um
brightness temperature difference).
Split-window image (12 um - 11 um
brightness temperature difference).In the image above a volcanic ash cloud is evident (brighter colors; positive 12 um – 11 um brightness temperature difference) near and northeast of Popocatepetl in Mexico. The split-window imagery is useful, but other clouds can have similar split-window brightness temperature differences as ash clouds. In effort to take advantage of spectral differences of different cloud types (volcanic ash, meteorological water and ice clouds)—using the split-window information along with additional spectral information, as part of a false color image can result in greater separation between volcanic ash clouds and other meteorological clouds.
The three images below are the components used in a typical false color image used in this website: 12 um – 11 um brightness temperature difference in red, 11 um – 8.5 um brightness temperature difference in green, and 11 um brightness temperature in blue. To create each image, the floating-point brightness temperature and/or brightness temperature difference was scaled into a byte (0-255) for a range of floating point values. For example, the red image scales the 12 um – 11 um brightness temperature difference from -5.0 K to 6.0K into a (0-255) byte values. Negative brightness temperature differences correspond to small byte values (or low intensity (dark) red) and increasingly positive values correspond to large byte values (or high intensity (bright) red). The green and blue images are produced in analogous fashion. A false-color image is the combination of the three component images.
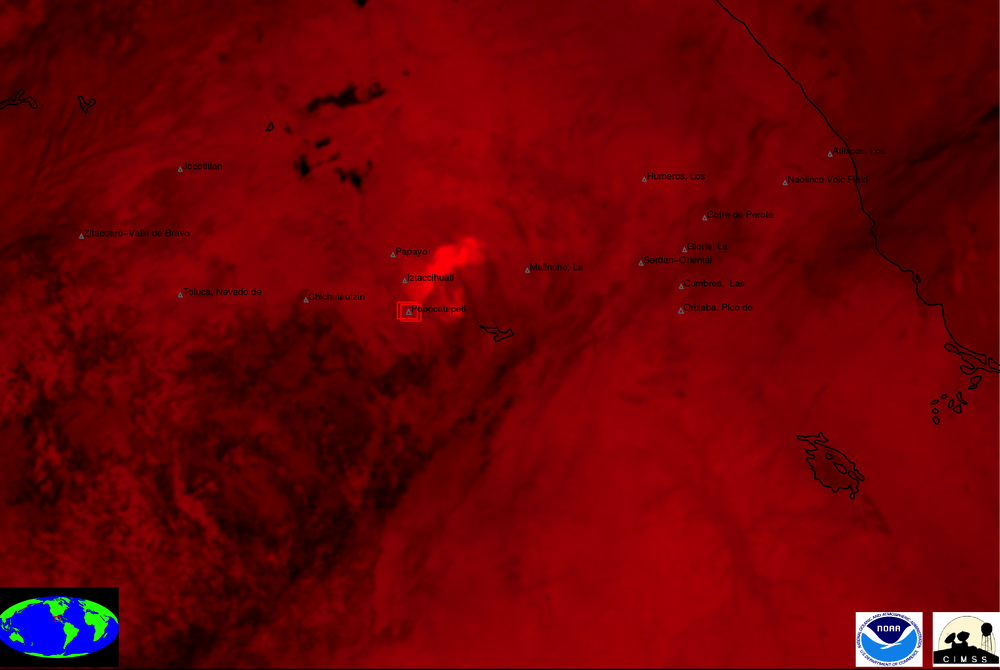 Red (12 - 11 um brightness temperature difference)
 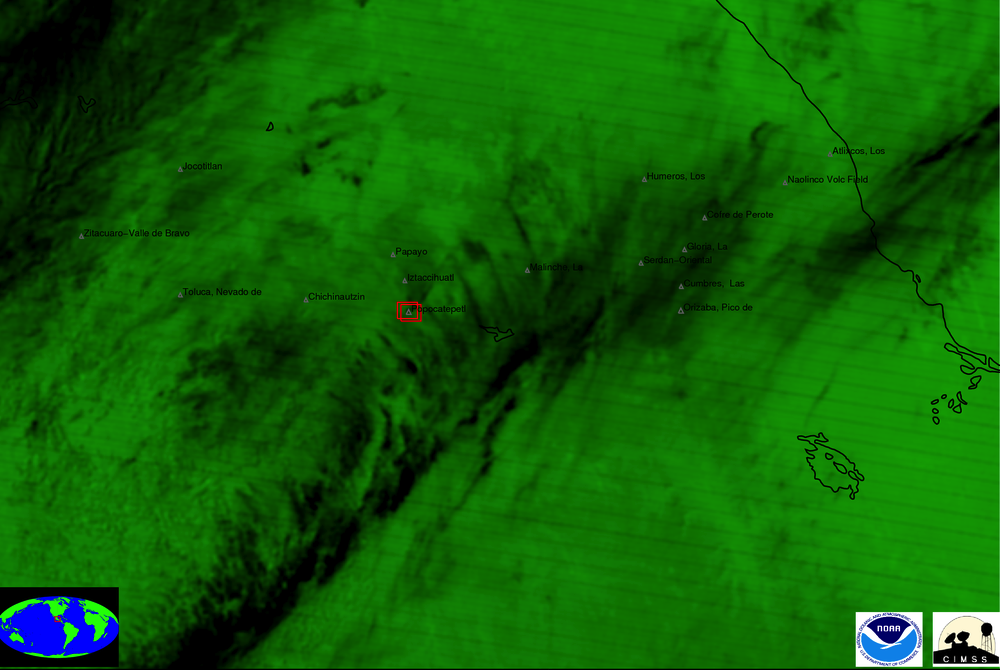 Green (11 - 8.5 um brighntess temperature difference)
 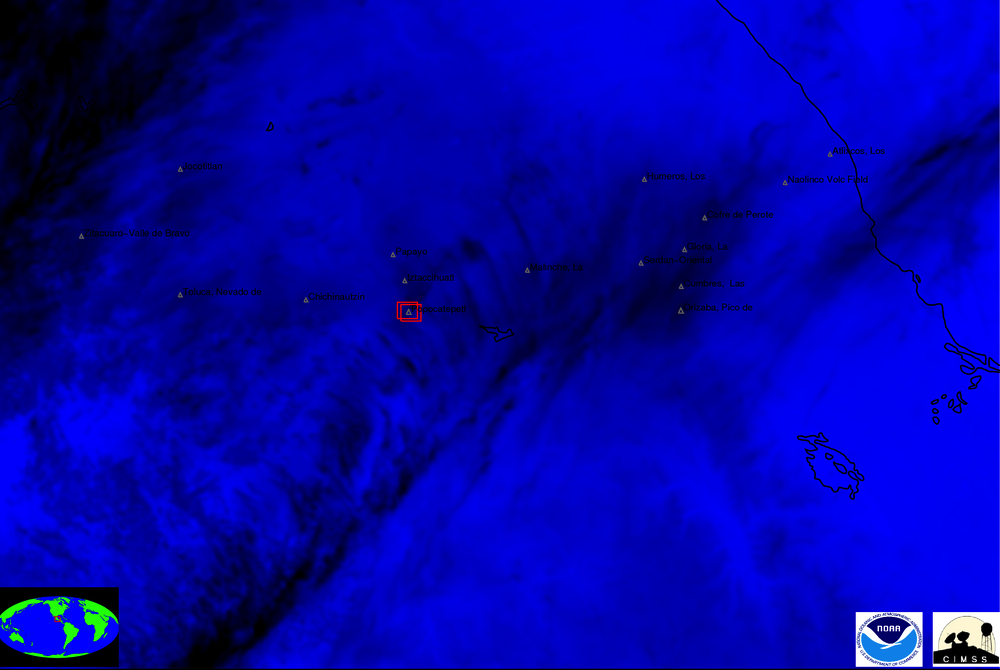 Blue (11 um brightness temperature)
 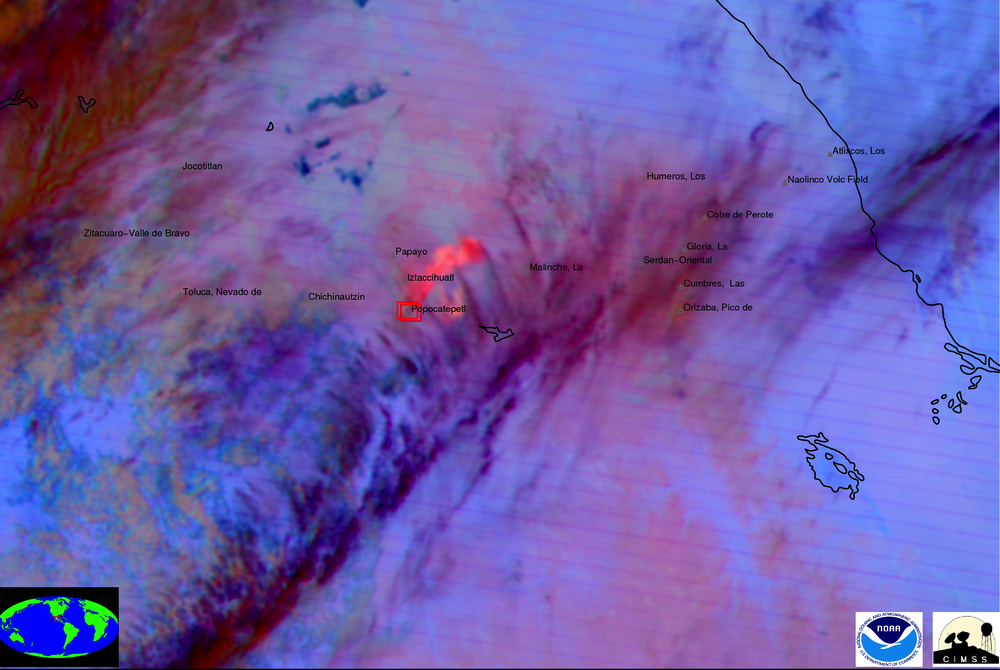 False Color Image from the above red, green, and blue components.
In this example the volcanic ash cloud has high red intensity and comparatively lower green and blue intensities, therefore the volcanic ash appears red/pink/magenta in the false color imagery. The section below briefly discusses the general appearance of various features in the volcanic ash/dust false color images.
Any spectral information can be used in a similar fashion and depending on what spectral channels are available for given sensor, different combinations are used. For example, for MTSAT, the 8.5 um channel is not available, so the 11 - 3.9 um brightness temperature difference is used for the green component. For GOES, the 12 um channel is not available, so the 13 um - 11 um brightness temperature difference is used for the red component.
Volcanic Ash/Dust False Color Imagery
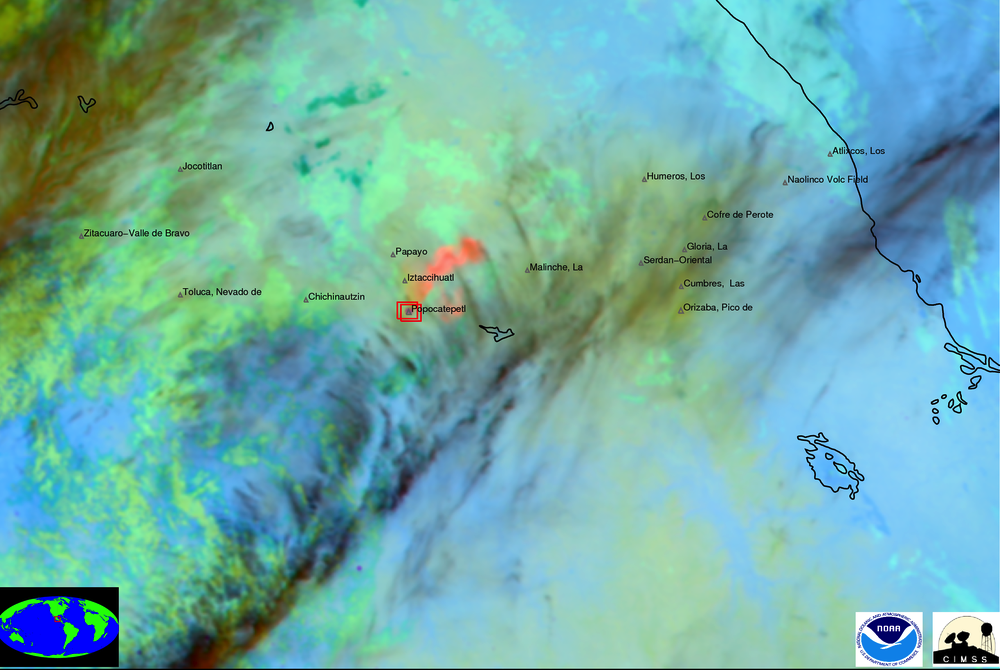
False Color Image: 12-11um (red), 11-8.5um (green), 11 um (blue) (e.g., MODIS, SEVIRI, ABI, VIIRS)The more 'advanced' sensors contain an 8.5 um channel in addition to the traditional 3.9, 11, and 12 um channels. Radiation at 8.5 um in general interacts similarily with ash and dust as at 3.9 um radiation, except the complexities of solar reflection are mitigated. Additionally (although not shown in this example), the 8.5 um channel can be used to infer the presence of sulfur dioxide within a volcanic plume and in some cases the 8.5 um channel can be used to detect ash that is otherwise invisible when using the 3.9 um channel.
 False Color Image: 12-11um (red), 11-3.9um (green), 11 um (blue) (e.g., MTSAT, AVHRR)
The 'heritage' sensors lack the 8.5 um channel, but generally offer 3.9, 11, and 12 um channels. While meteorological (ice and water) clouds and surfaces often appear differently in false color imagery with the 8.5 um vs. the 3.9 um channel, ash clouds generally appear similar, in varying shades of pink/magenta/red.
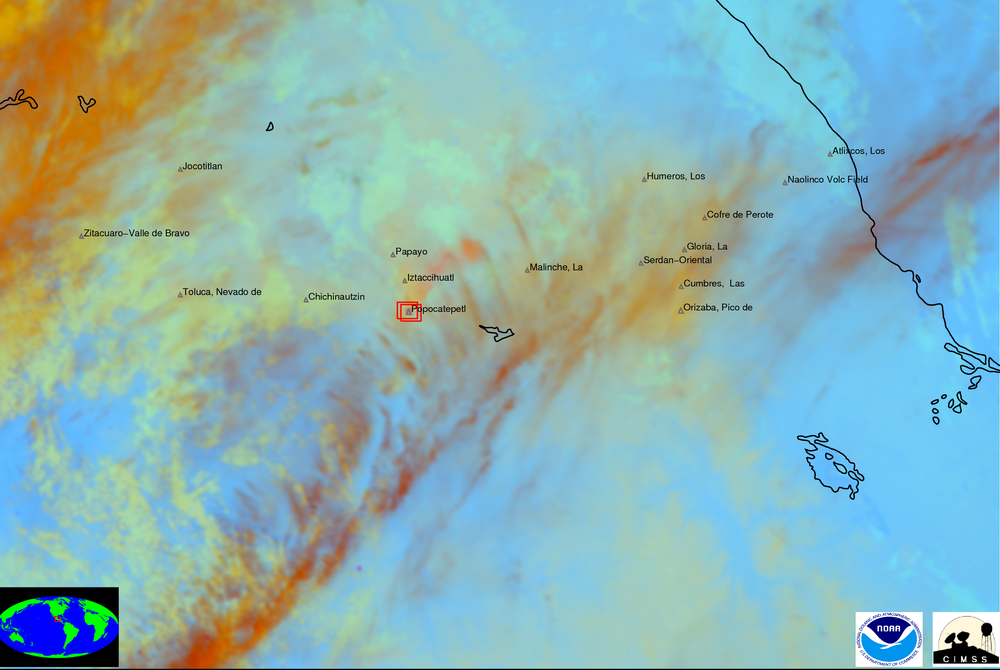 False Color Image: 13-11um (red), 11-3.9um (green), 11 um (blue) (e.g., GOES)
The current GOES series imagers do not have a 8.5 um channel nor a 12 um channel. The 12 um channel was replaced with the 13.3 um channel (sensitive to carbon dioxide absorption). This set of spectral information is rather limited for identifying volcanic ash. As can be seen in the above image, the volanic ash plume is a faint brown-red color, not that dissimilar from surrounding nearby meteorological clouds, especially compared to the other false color imagery above.
Additional false color imagery
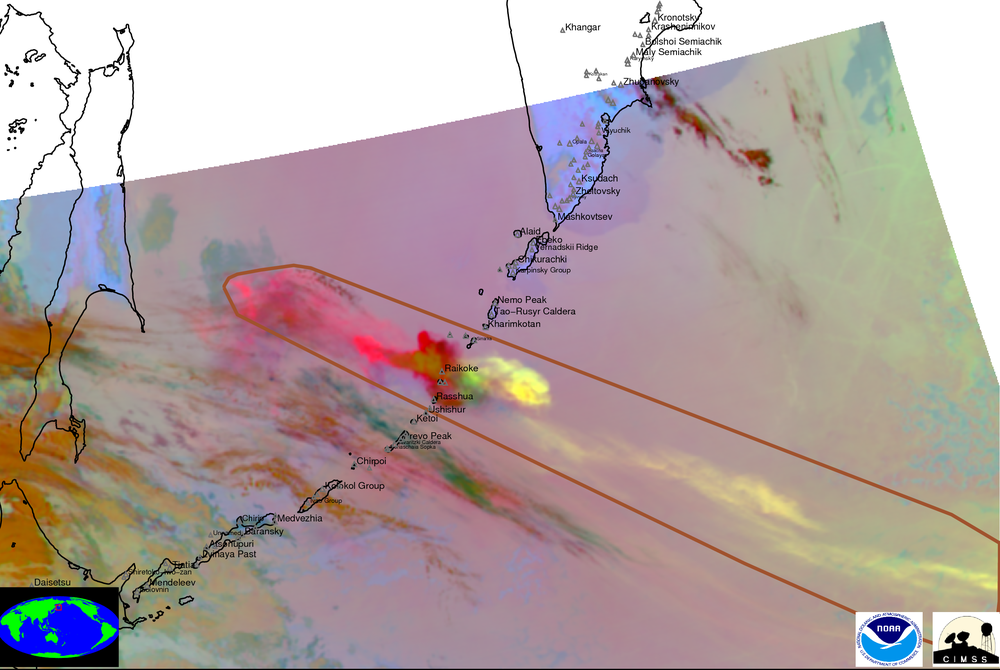 Example of obtaining plume composition information by using false color imagery with the 8.5 um channel.
This example is from the eruption of Sarychev Peak in June 2009. The ash plume is indicated by the brown polygon. To the west of Sarychev Peak, the ash plume has a magenta color, indicative of only volcanic ash. To the east the ash plume has more of a yellow color, indicitive of both ash and sulfur dioxide (the 8.5 um channel is sensitive the presence of sulfur dioxide). The appearance of volcanic ash appears the same day and night using this false color imagery.
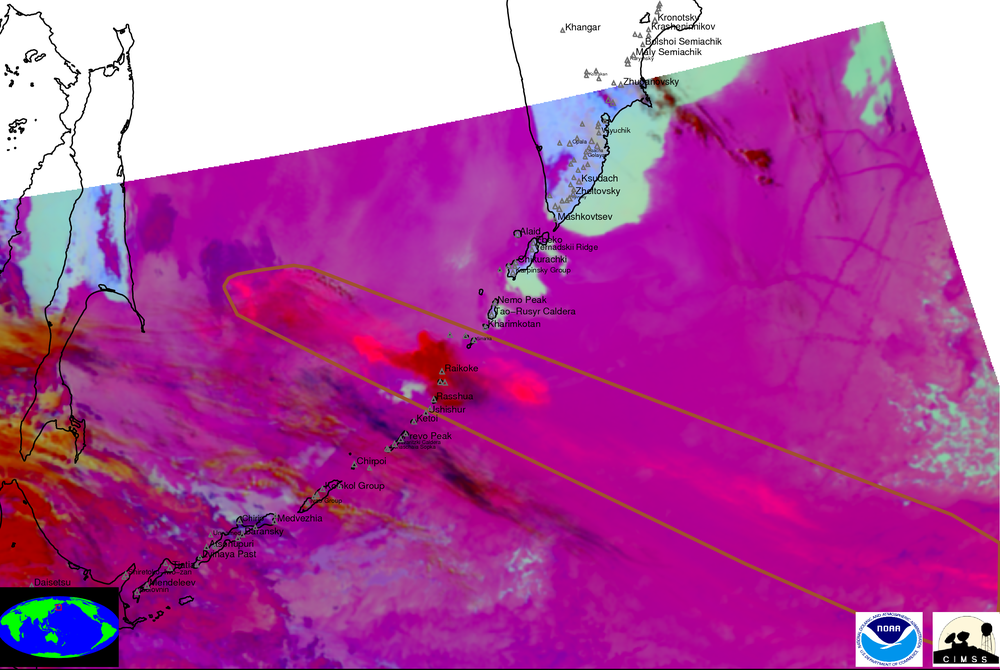 The corresponding false color image using the 3.9 um channel instead of the 8.5 um channel for the eruption of Sarychev Peak.
The ash plume is evident in this image, like in the false color image with the 8.5 um channel, except the plume generally appears magenta. The 3.9 um channel is only sensitive to volcanic ash and not sulfur dioxide. Additionally, the false color imagery using the 3.9um channel is sensitive to solar reflection during the daytime. This example was sunlit and the surrounding marine statocumulus clouds appear as a pink/purple color making the volcanic ash plume a bit more difficult to pick out compared to using the false color imagery with the 8.5 um channel.
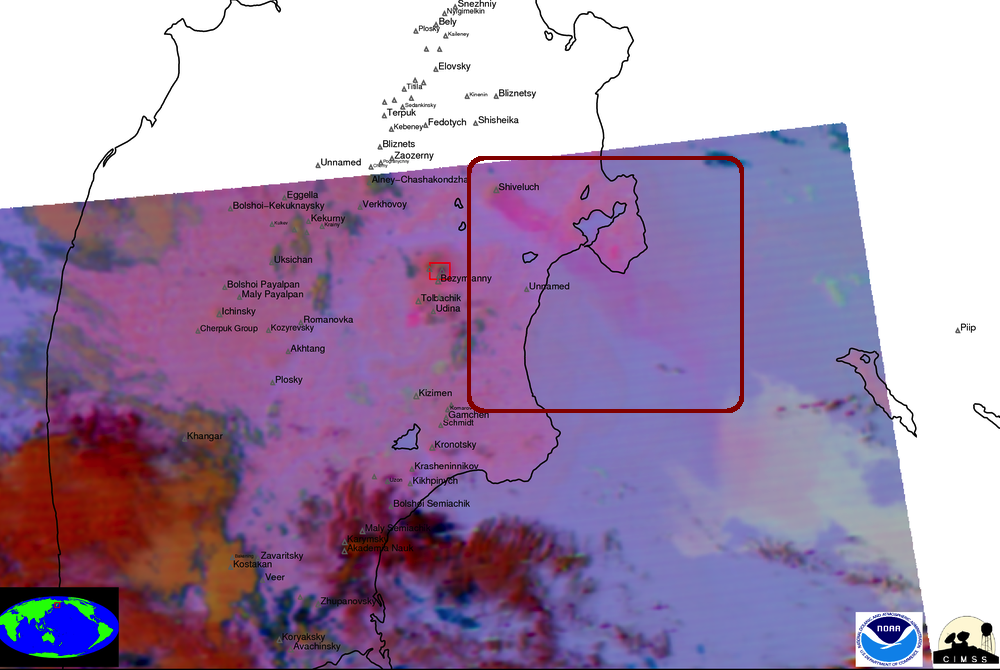 Example of ash evident from Shiveluch using the false color imagery with the 8.5 um channel.
A faint ash plume is evident within the brown box extending hundreds of kilometers to the southeast of Shiveluch on the Kamchatka peninsula.
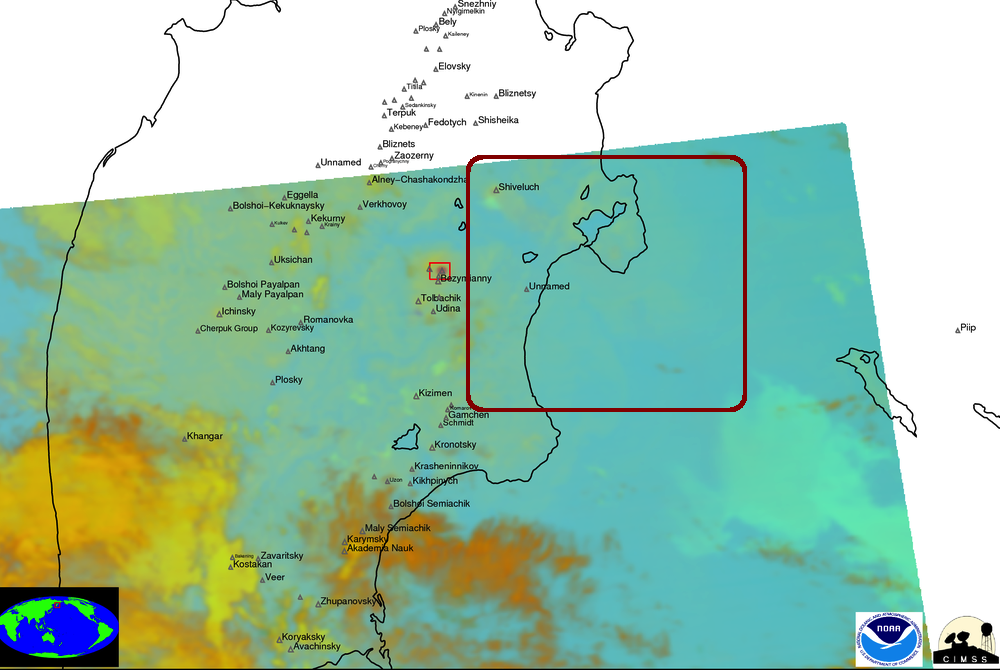 The corresponding false color image using the 3.9 um channel instead of the 8.5 um channel for the Shiveluch ash plume.
Usually ash plumes observed in false color imagery using the 8.5 um channel are also observed in false color imagery using the 3.9 um channel. However, this is an example of a plume that is invisible in the false color imagery using the 3.9 um channel due to complexities in the boundary layer and motivates the use the 8.5 um channel false color imagery in addition to the 3.9 um false color imagery.
Product Imagery
This section describes non-false color imagery avaiable within alert reports and in the satellite imagery sections of the website.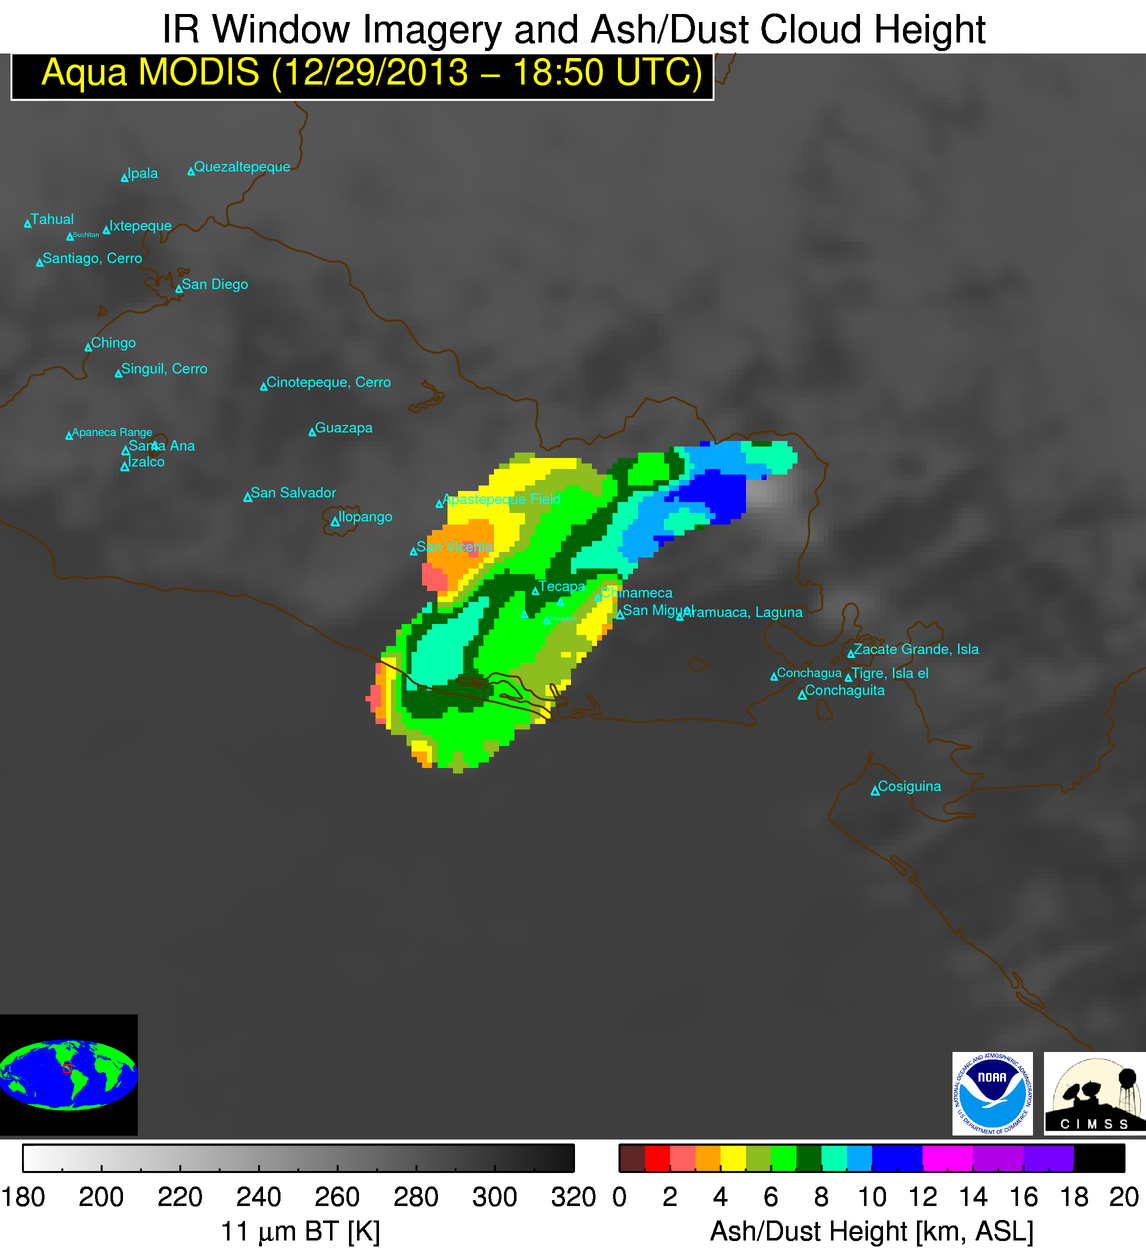 Sample ash height retrieval image with 11 um brightness temperature underlay.
When an ash cloud is detected, the radiometrically retrieved heights [kilometers above sea level] are plotted in color with the 11 um brightness temperature [K] plotting in grayscale as an image underlay. A pixel with valid retrieved height is indicitive of a pixel included in a detected ash cloud object. If no ash cloud is detected the image will simply show 11 um brightness temperature in grayscale.
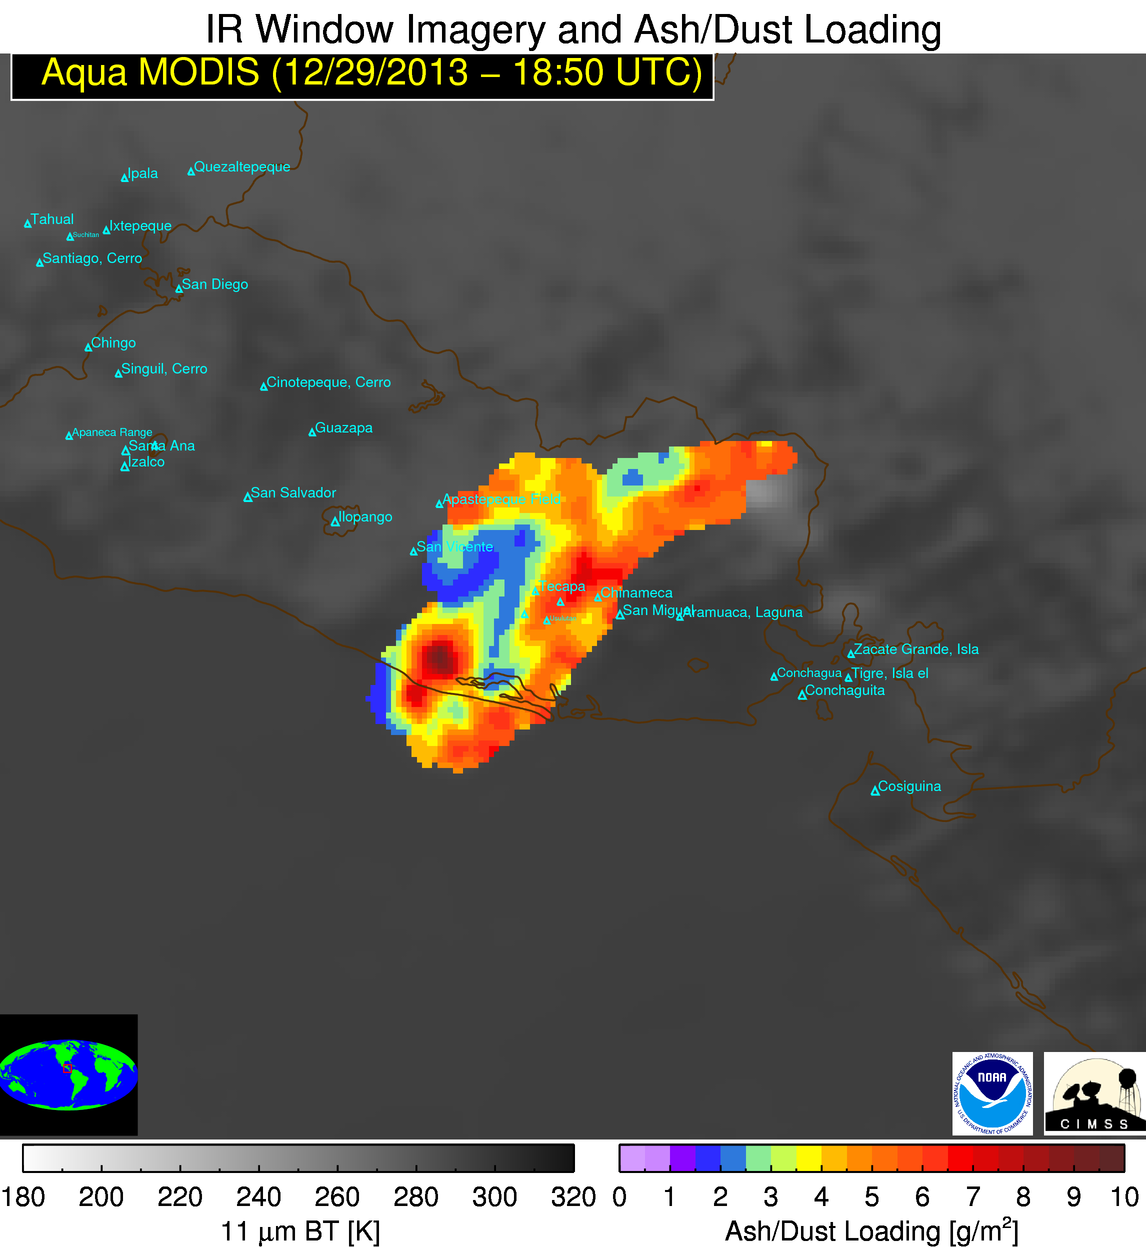 Sample ash mass retrieval image with 11 um brightness temperature underlay.
When an ash cloud is detected, the retrieved mass loading [grams per square meter] are plotted in color with the 11 um brightness temperature [K] plotting in grayscale as an image underlay. A pixel with valid retrieved mass loading is indicitive of a pixel included in a detected ash cloud object.
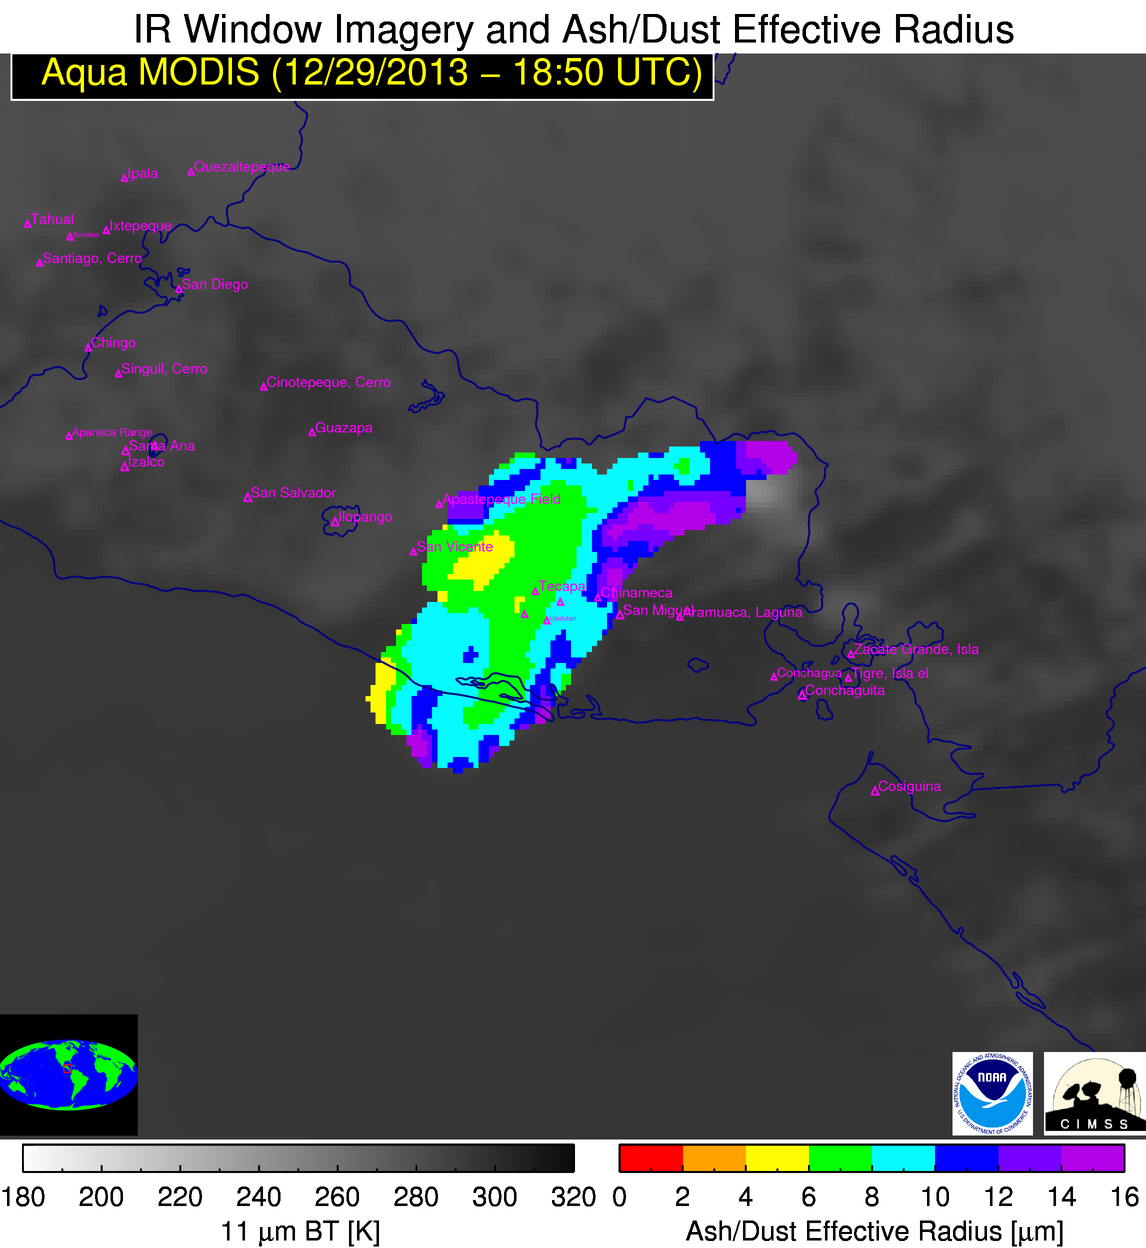 Sample ash effective radius retrieval image with 11 um brightness temperature underlay.
When an ash cloud is detected, the retrieved particle effective radius [microns] are plotted in color with the 11 um brightness temperature [K] plotting in grayscale as an image underlay. A pixel with valid retrieved effective radius is indicitive of a pixel included in a detected ash cloud object.
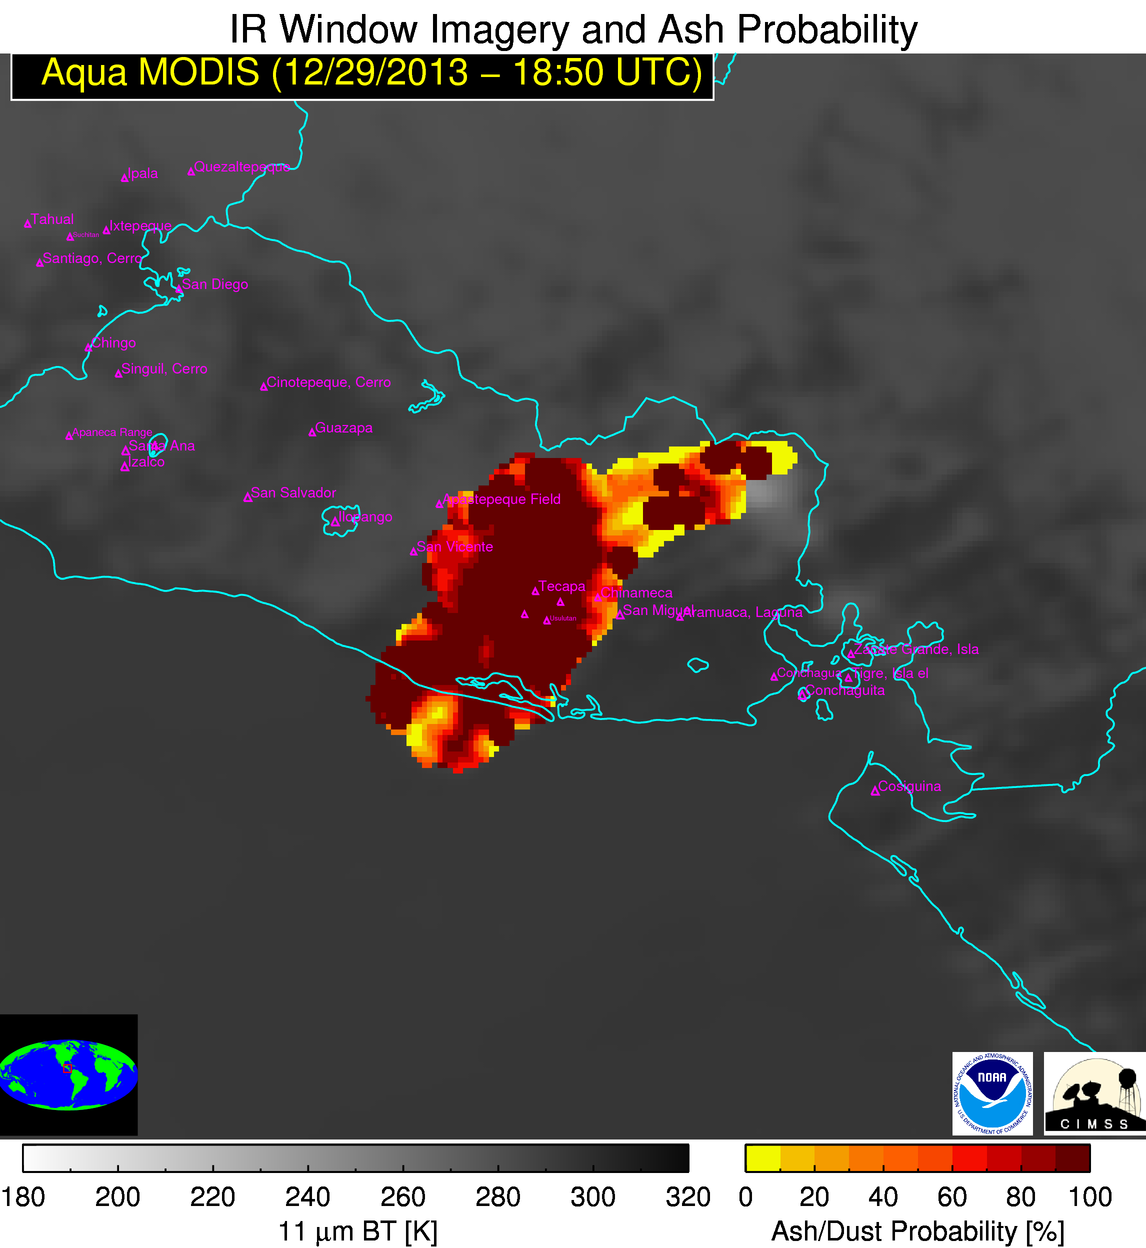 Sample ash probabilitiy with 11 um brightness temperature underlay.
When an ash cloud is detected, each individual pixel probability is plotted in color with the 11 um brightness temperature [K] plotting in grayscale as an image underlay. A pixel with valid ash probability is indicitive of a pixel included in a detected ash cloud object.
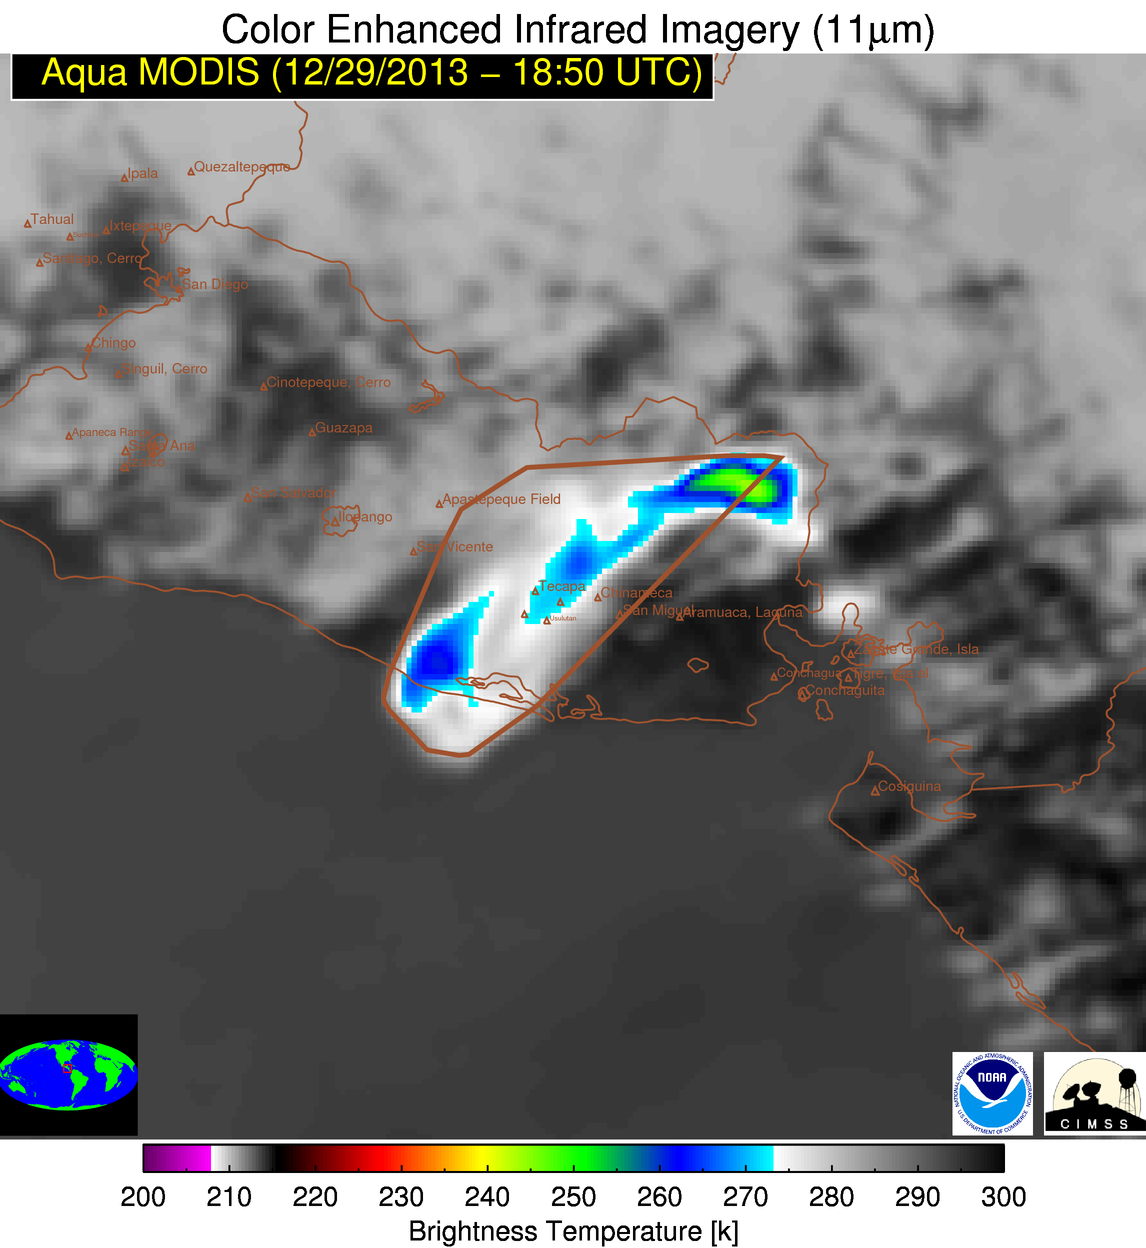 Sample color-enhanced 11 um brightness temperature image.
The 11um brightness temperature is displayed with a color enhacement. If an ash cloud is detected, the bounds of the cloud are outlined by a brown polygon. If a volcanic Cb was detected it will be annotated by a magenta arrow. If a volcanic thermal anomaly is present it is identified by a red box.
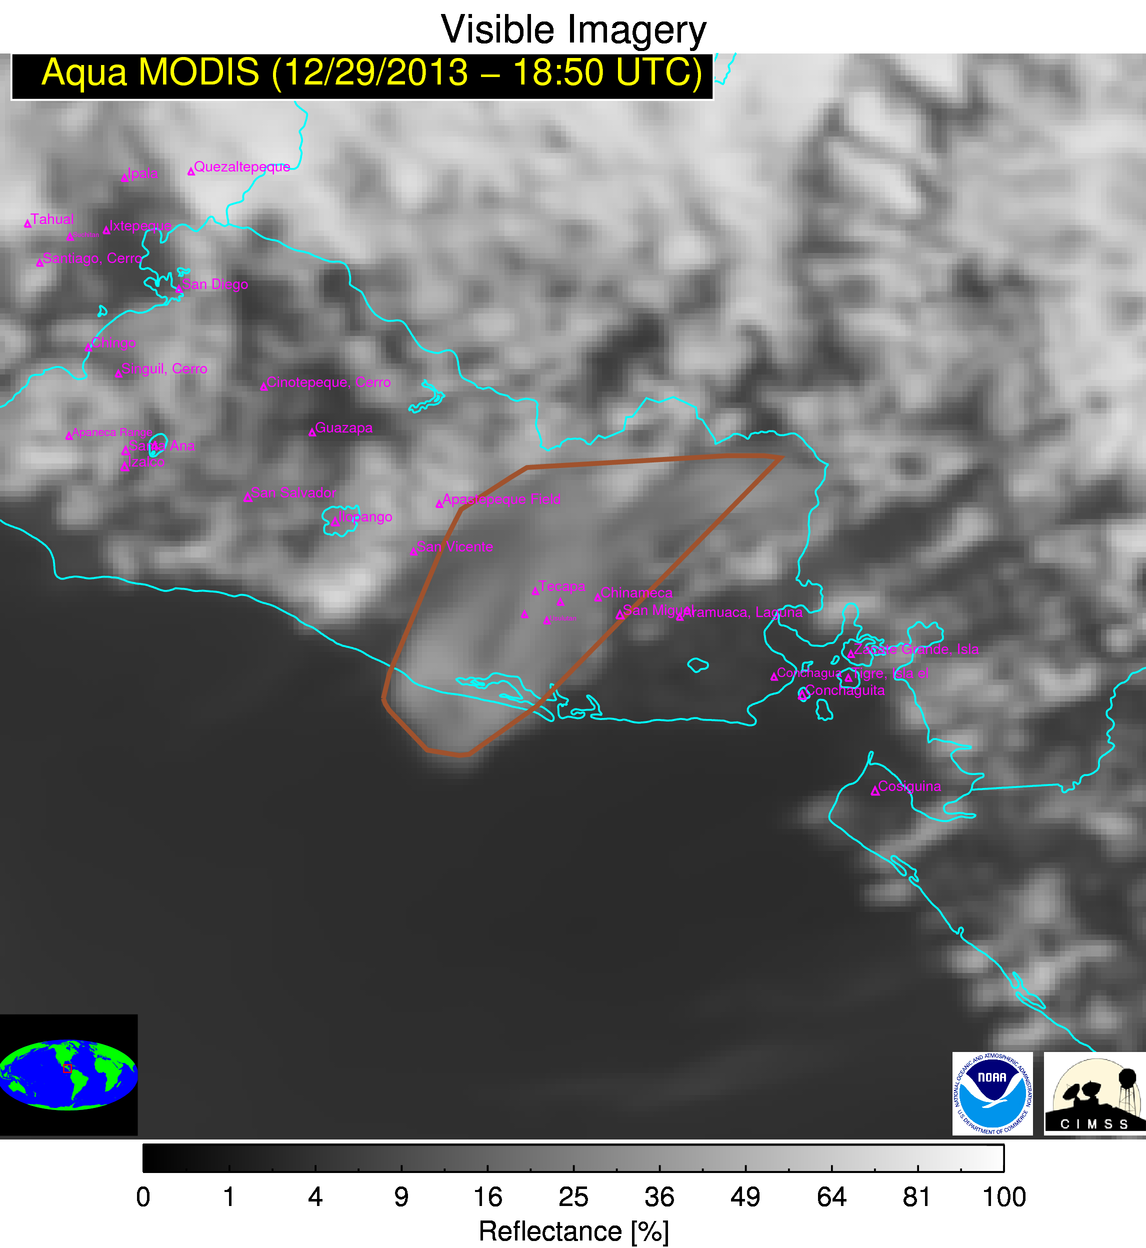 Sample visible reflectance image.
The 0.65 um (visible) reflectance is displayed with a grayscale enhacement. If an ash cloud is detected, the bounds of the cloud are outlined by a brown polygon. If a volcanic Cb was detected it will be annotated by a magenta arrow. If a volcanic thermal anomaly is present it is identified by a red box.
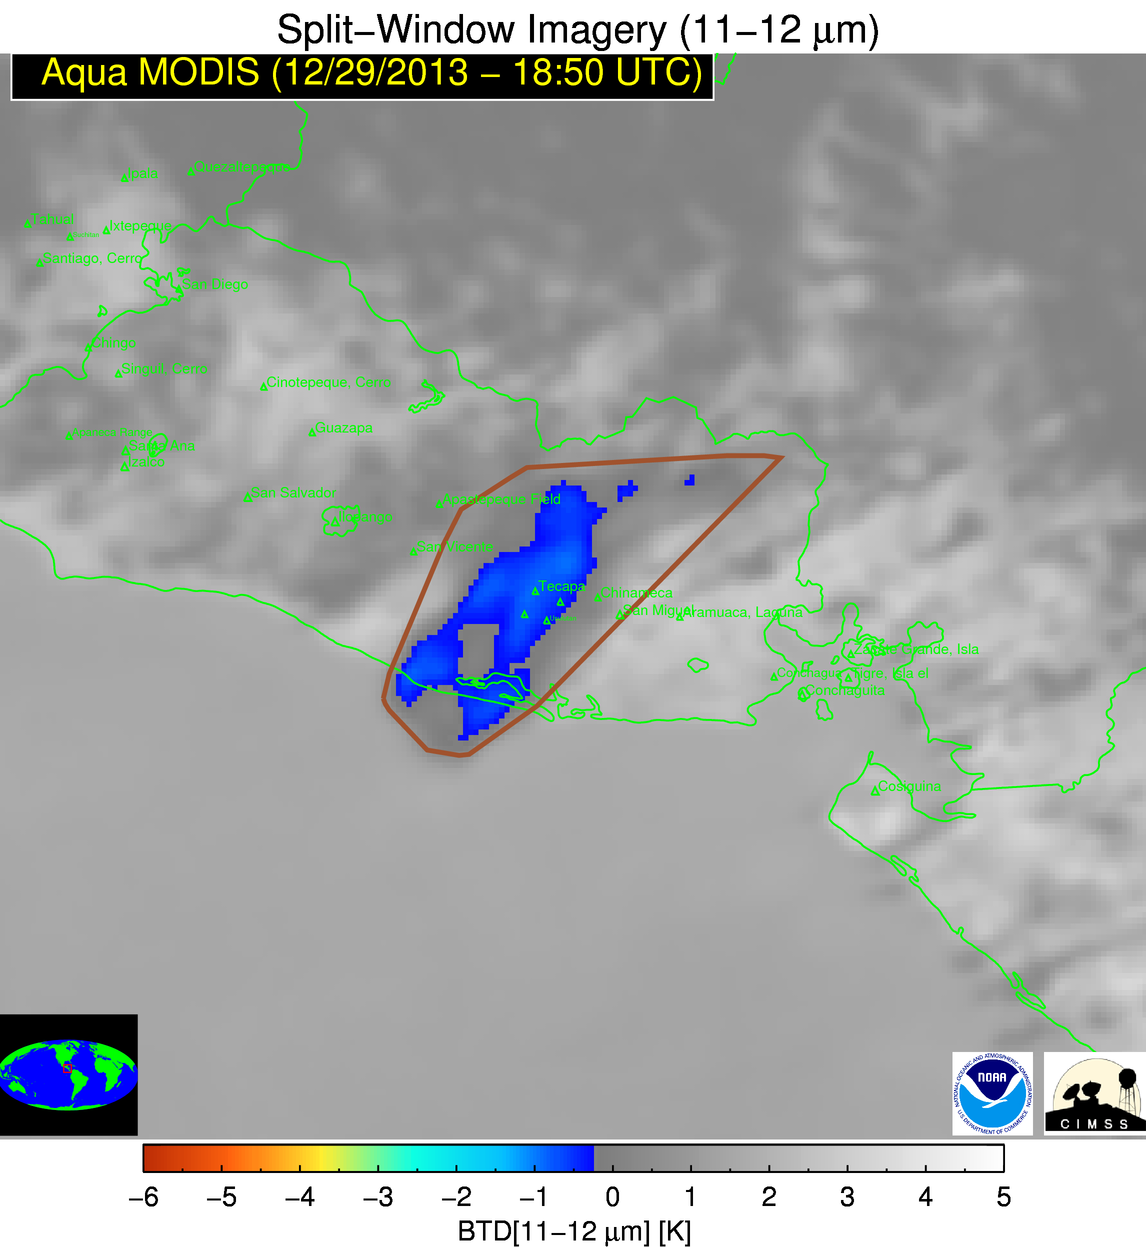 Sample color-enhanced split window brightness temperature difference image.
The 11 - 12 um brightness temperature difference is displayed with a color enhacement, with colors used for brightness temperature differences of -0.25 K and less. If an ash cloud is detected, the bounds of the cloud are outlined by a brown polygon. If a volcanic Cb was detected it will be annotated by a magenta arrow. If a volcanic thermal anomaly is present it is identified by a red box.
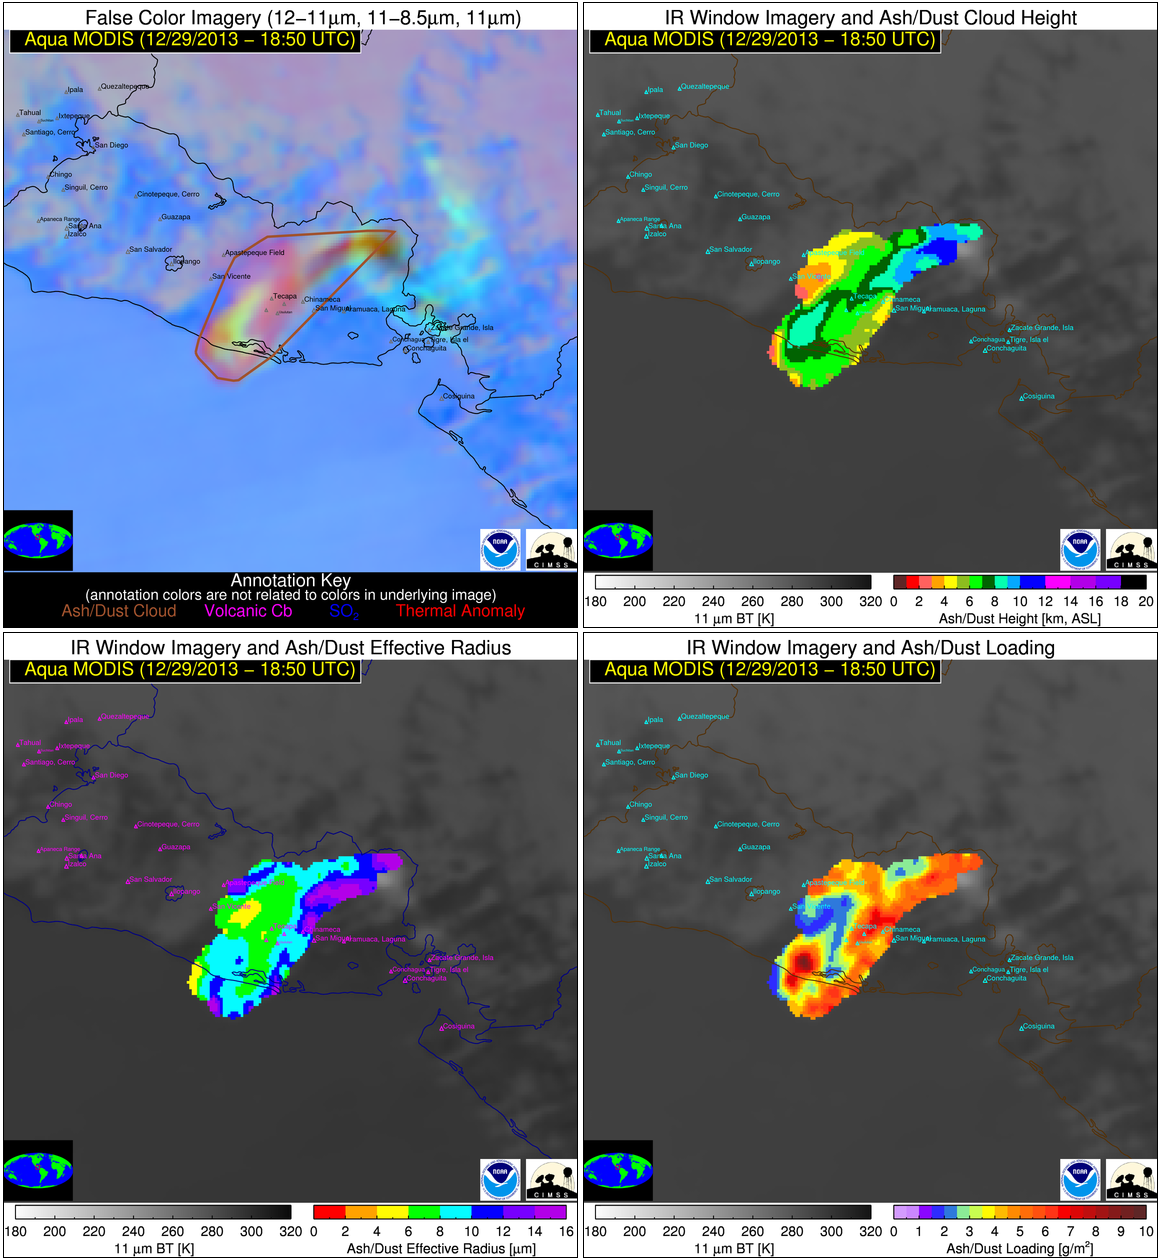 Sample four panel image.
The false color image(s) and three ash retrieveal images (height, mass loading, and effective radius) are combined into a single four panel image(s) for quick reference.
Subscription Customization
It is possible to receive volcanic cloud alerts in your email and/or via SMS text message in real-time. This section demonstrates how to create and edit your subscription(s) as well as customize what alerts you receive (account required).
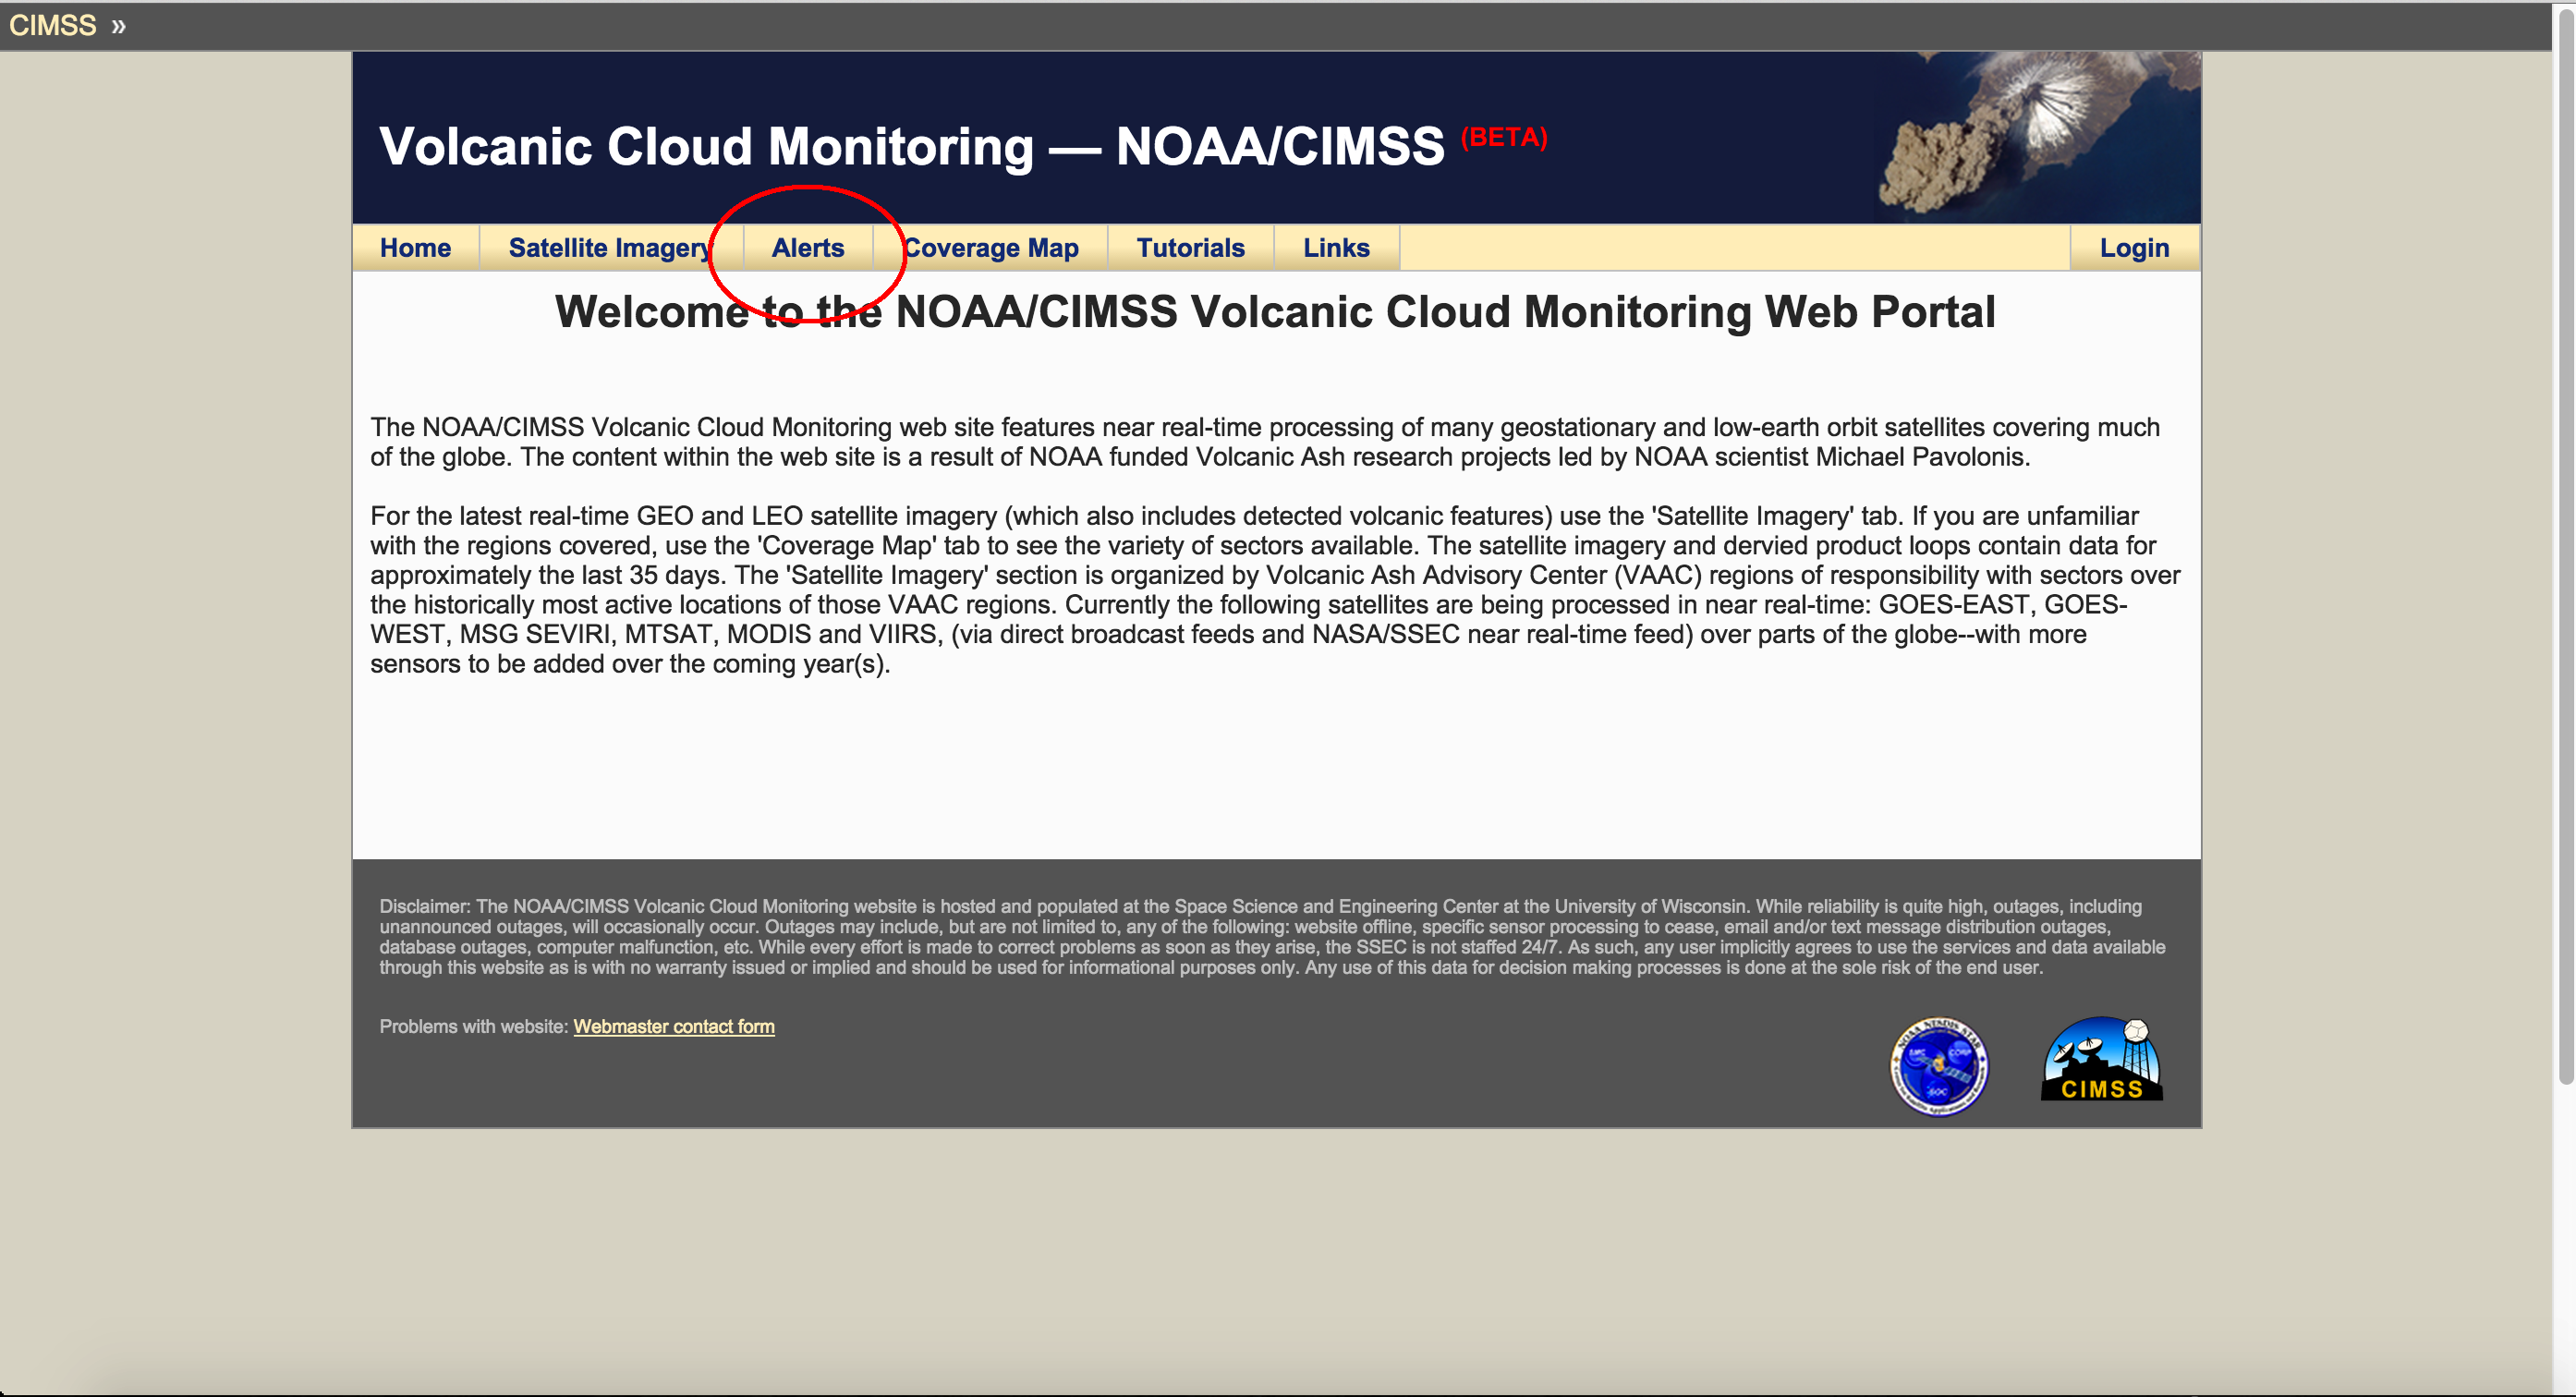
1) To subscribe to real-time delivery of alerts click on the "Alerts" tab at the top of the web site.
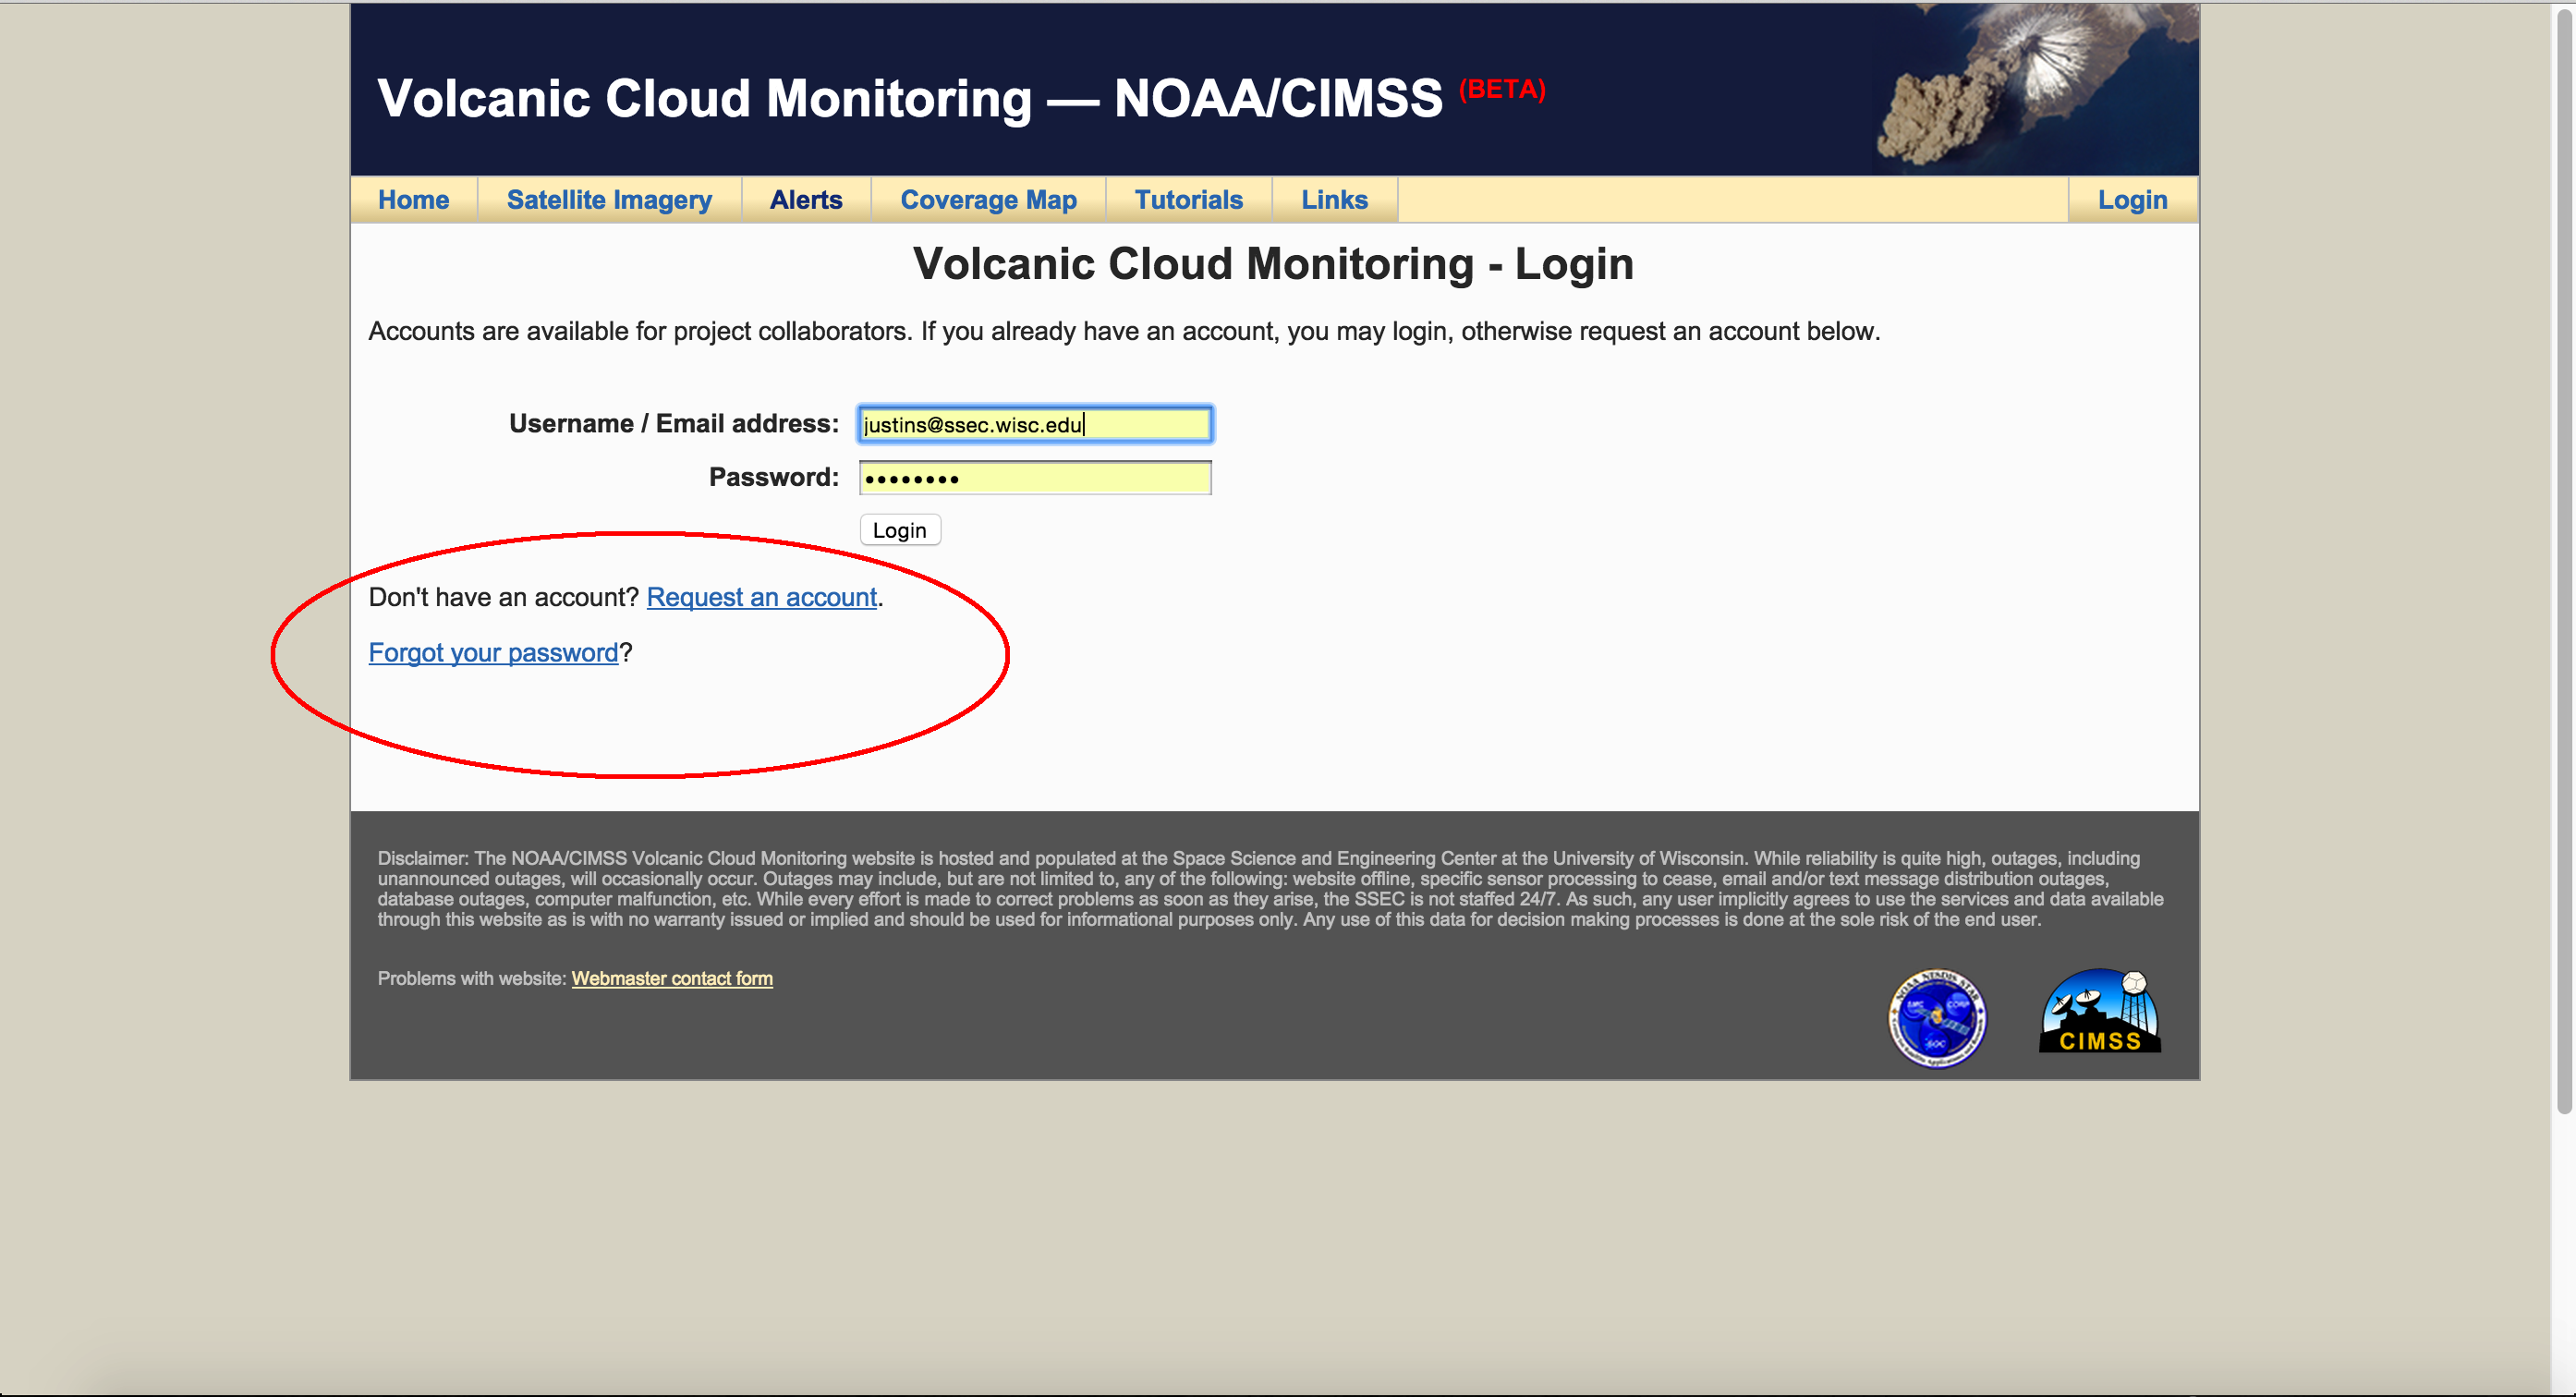
2) After clicking on the Alert tab, you will be prompted to login using your email address and password. If you have not already applied for an account you can request an account from this page. An approved account is necessary to view alerts and add alert subscriptions.
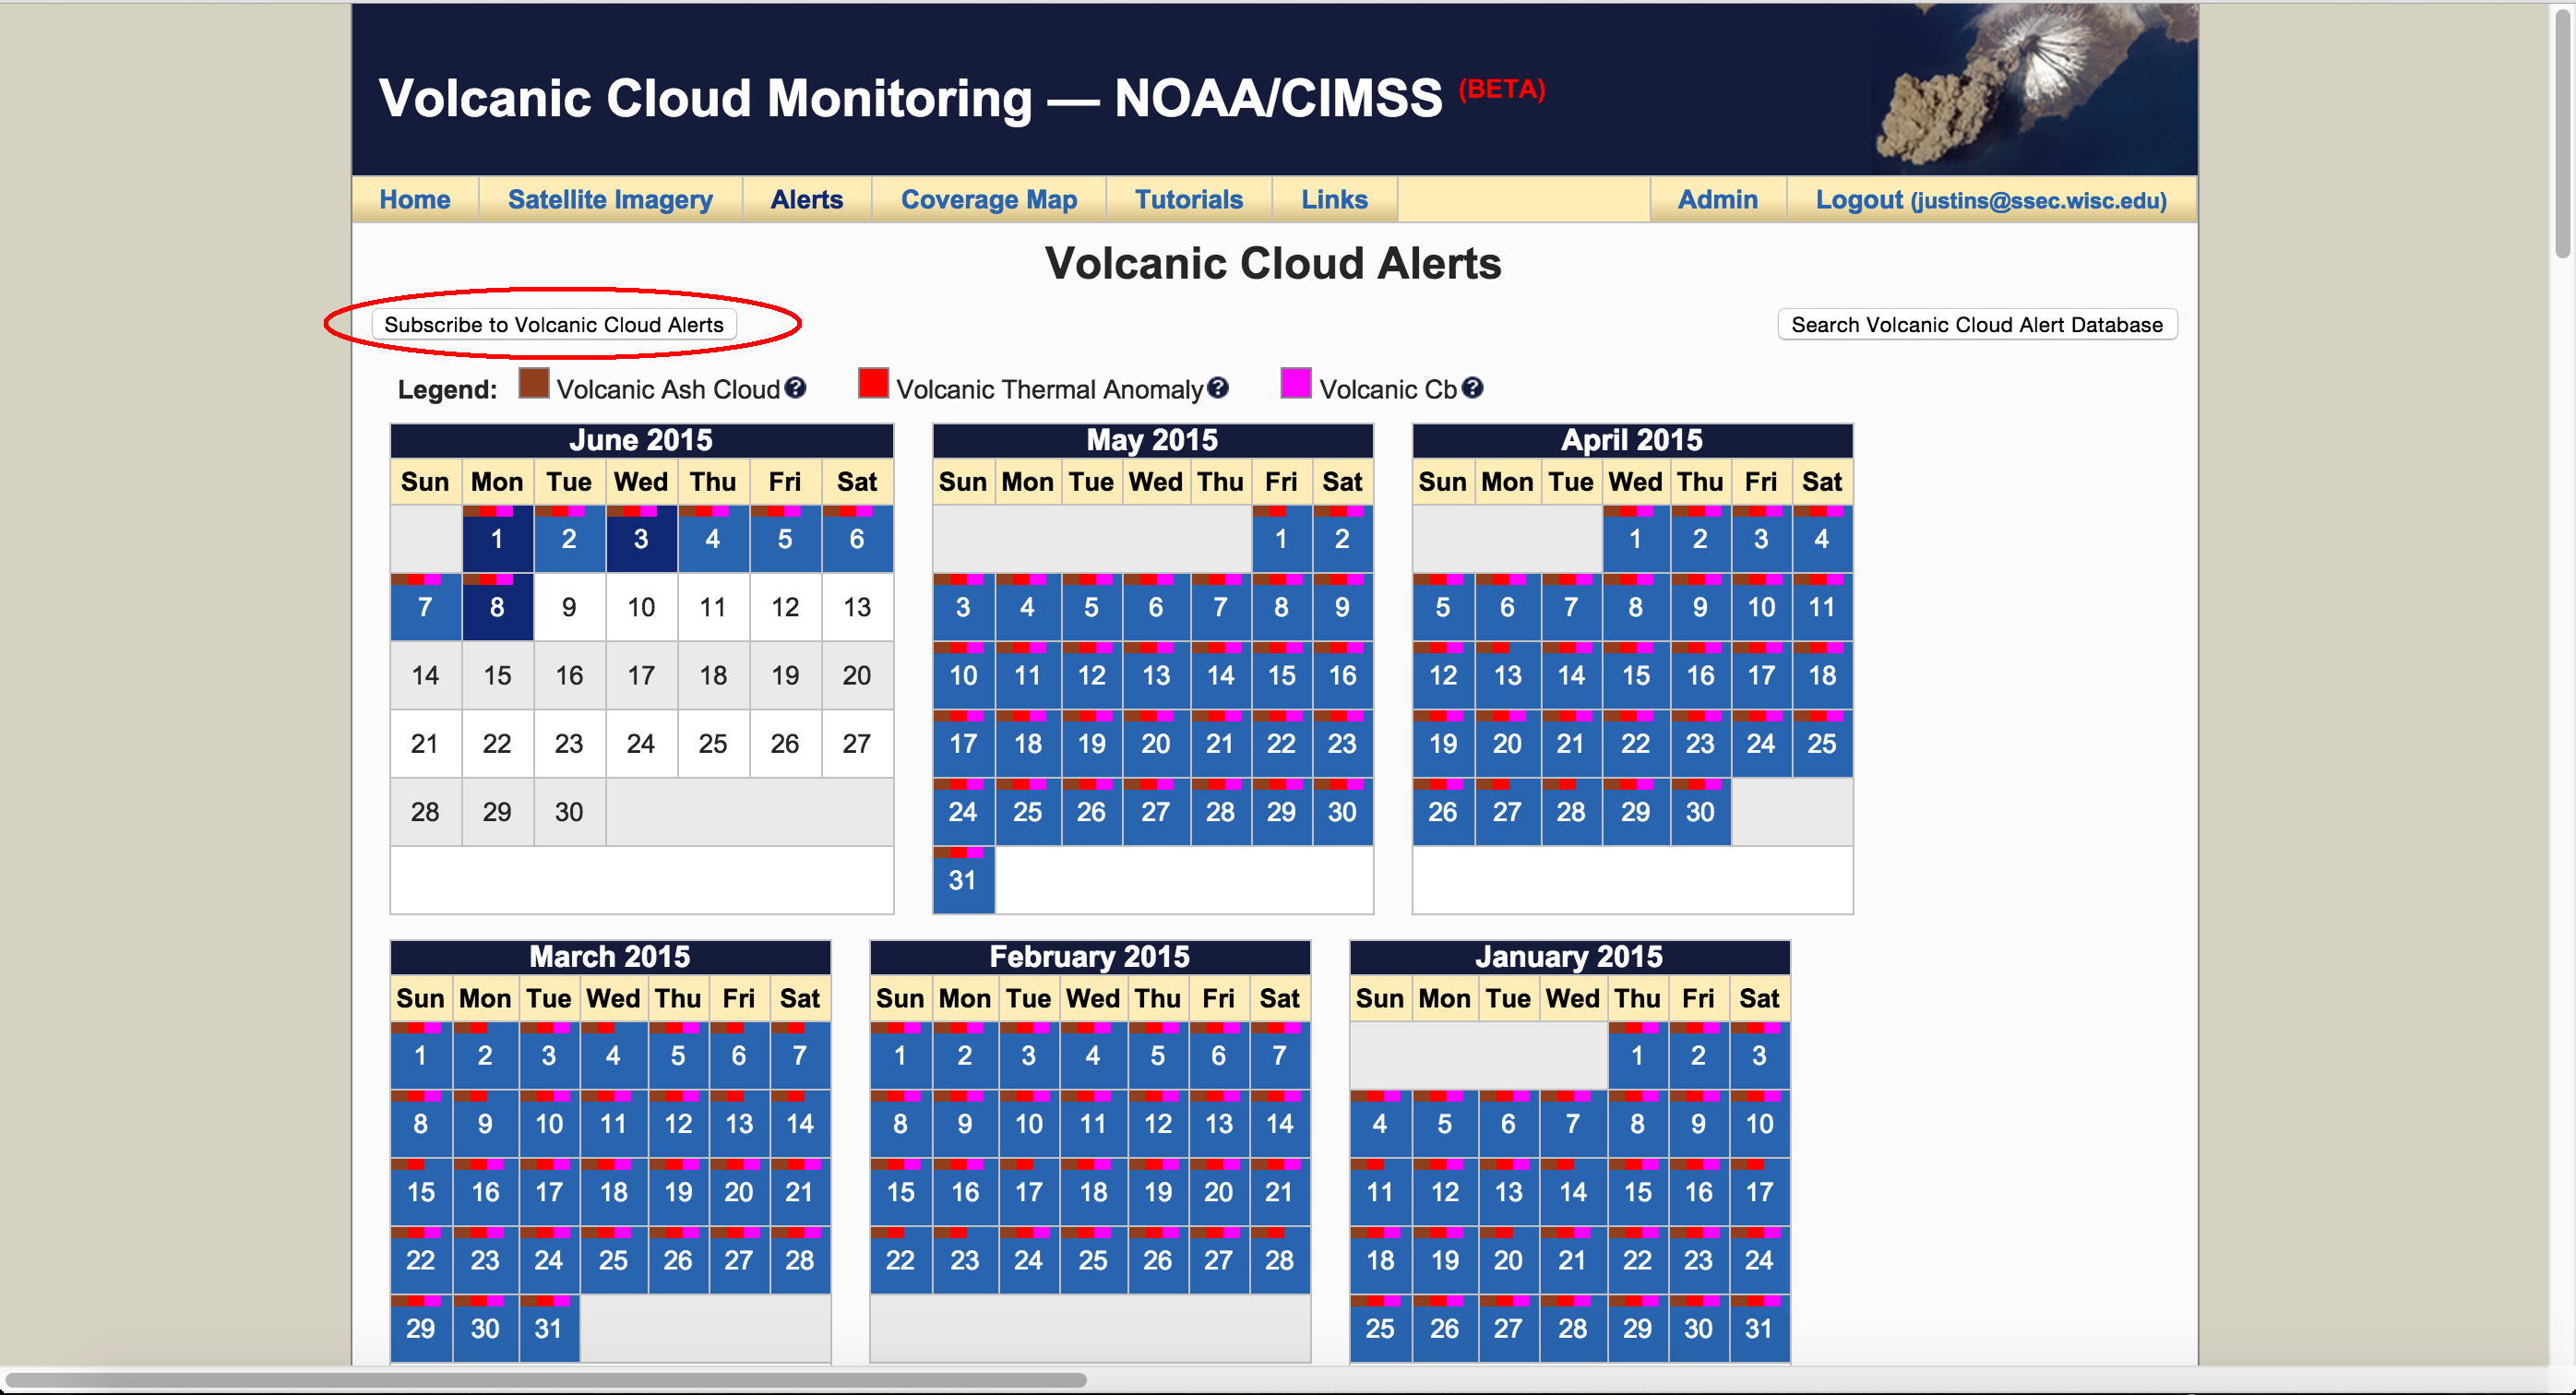
3) Upon logging in the alerts page will look similar to the screenshot below, with a calendar of alerts. This page is where you can add a subscription to real-time delivery of alerts. Click the "Subscribe to Volcanic Cloud Alerts" button located in the upper left corner of the alerts page.
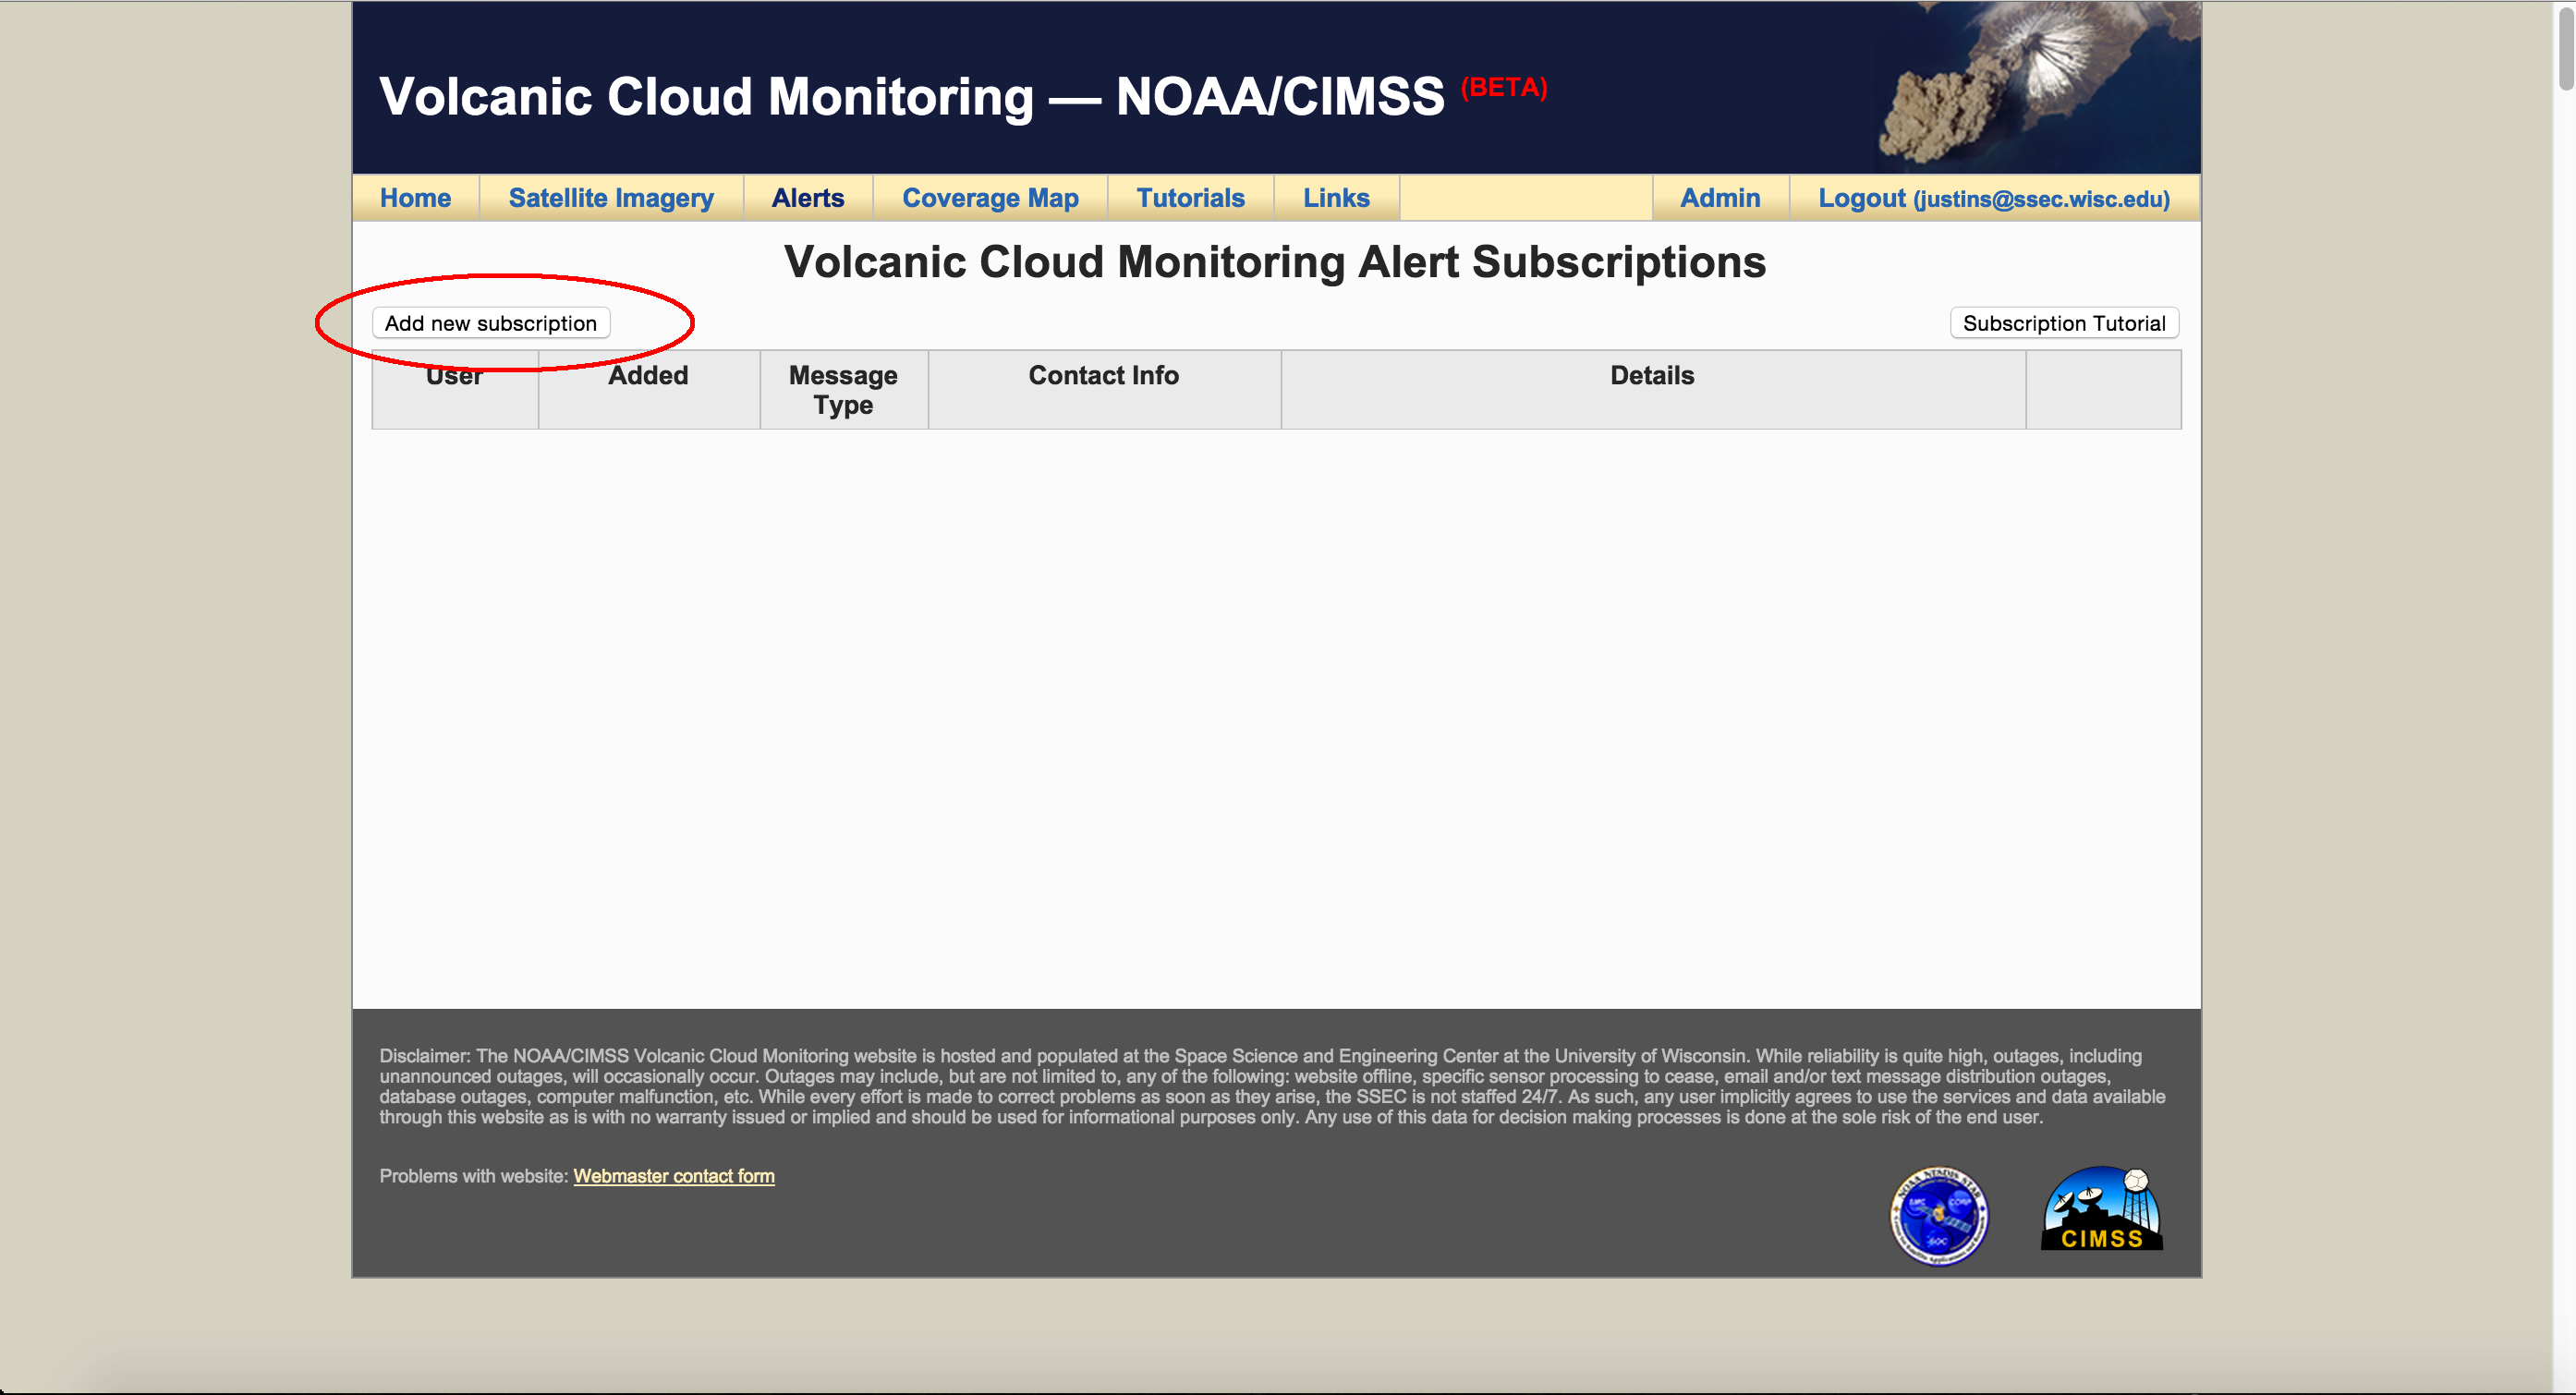
4) Click the "Add new subscription" button. This page will also list your subscriptions after they are complete.
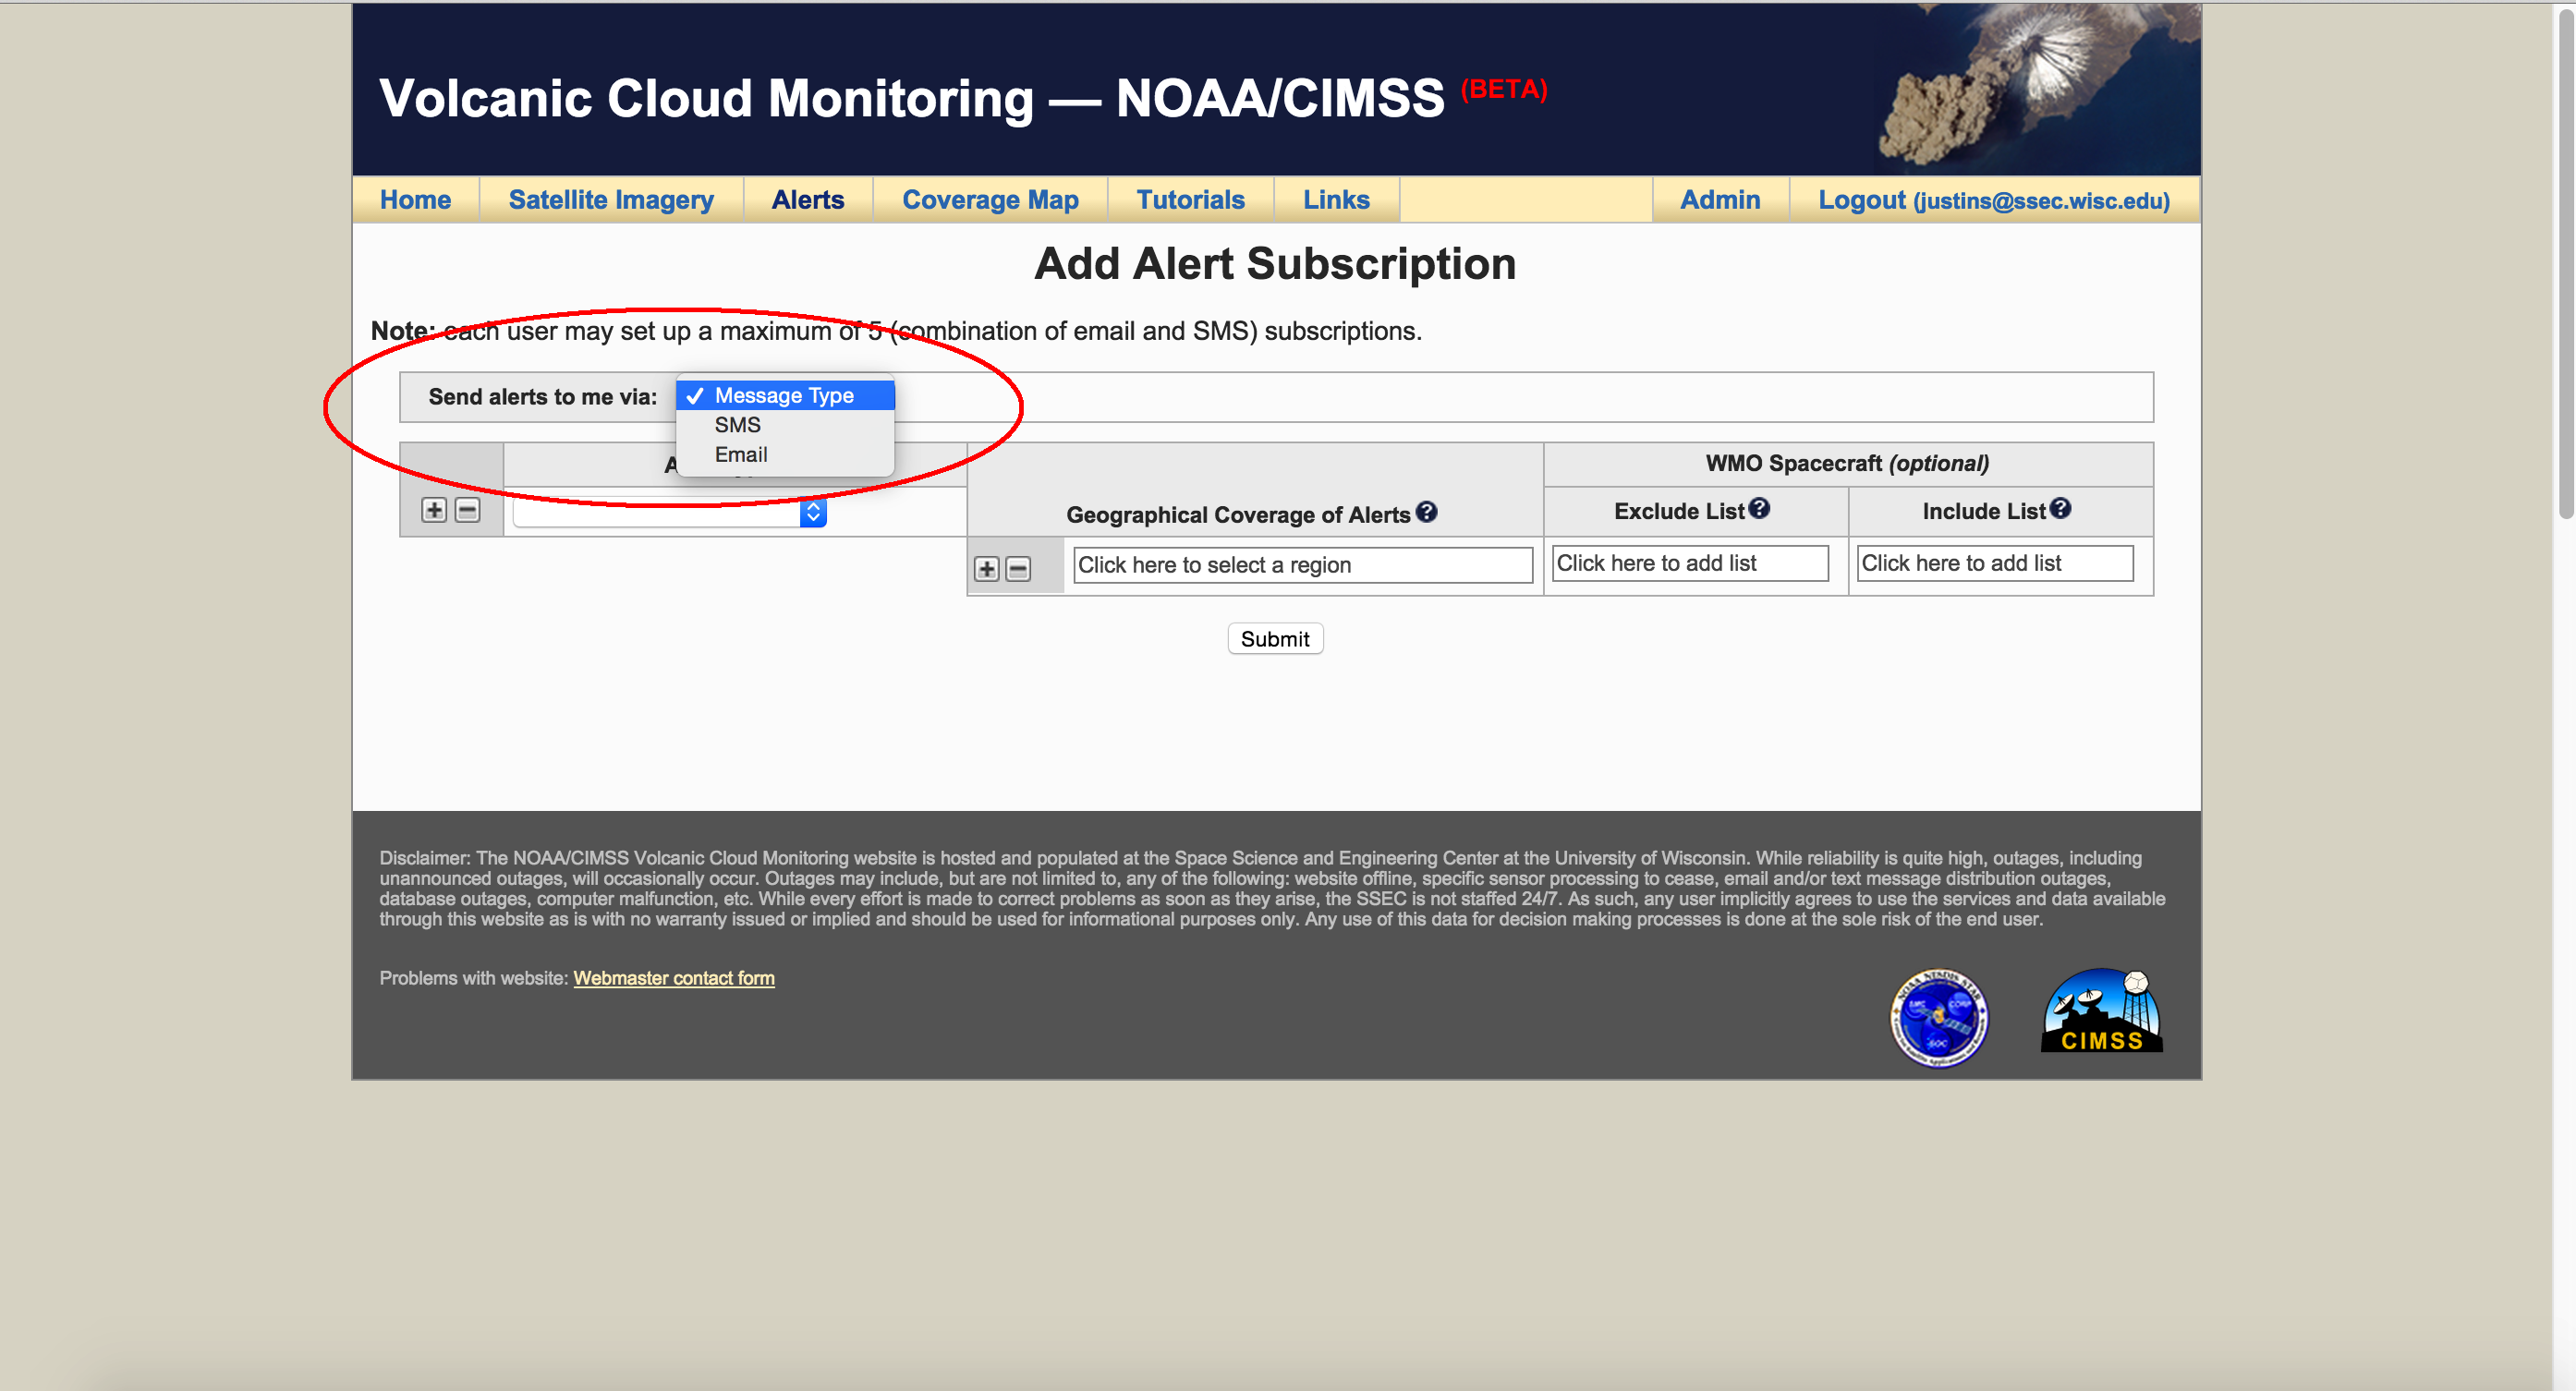
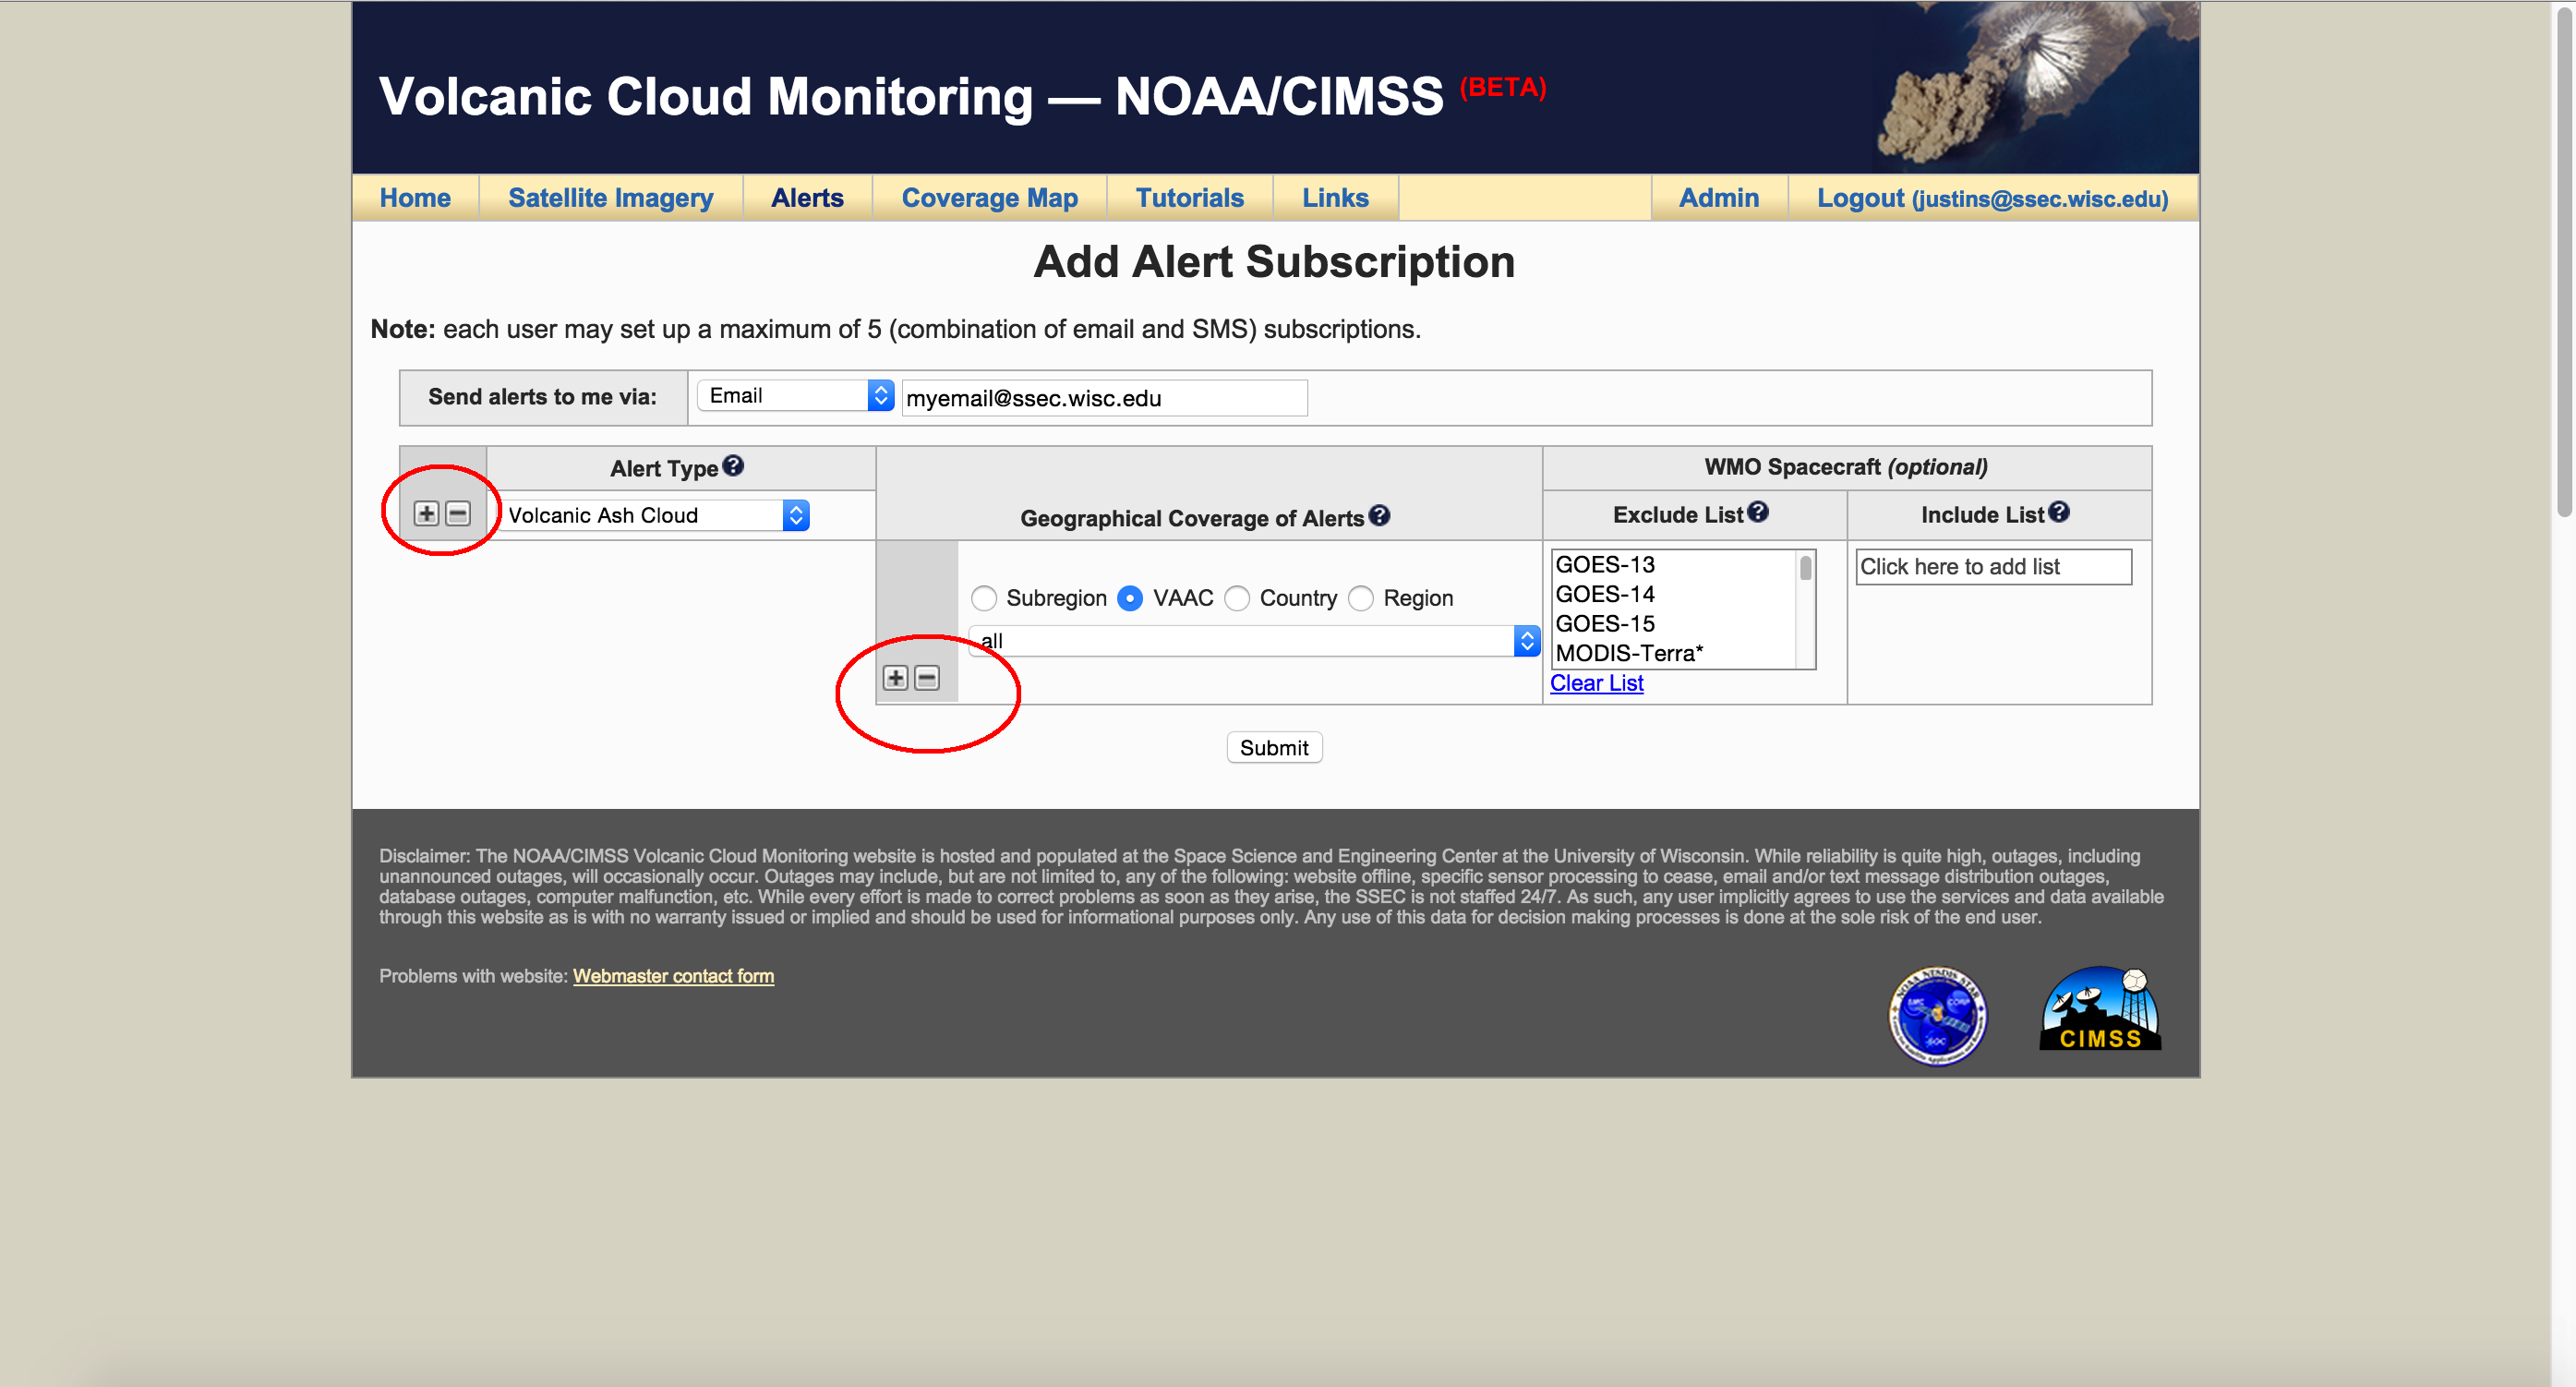
5) The first information necessary for adding a subscription is whether the alerts will be delivered via email or SMS text message (if you desire both, you will need to add two separate subscriptions).
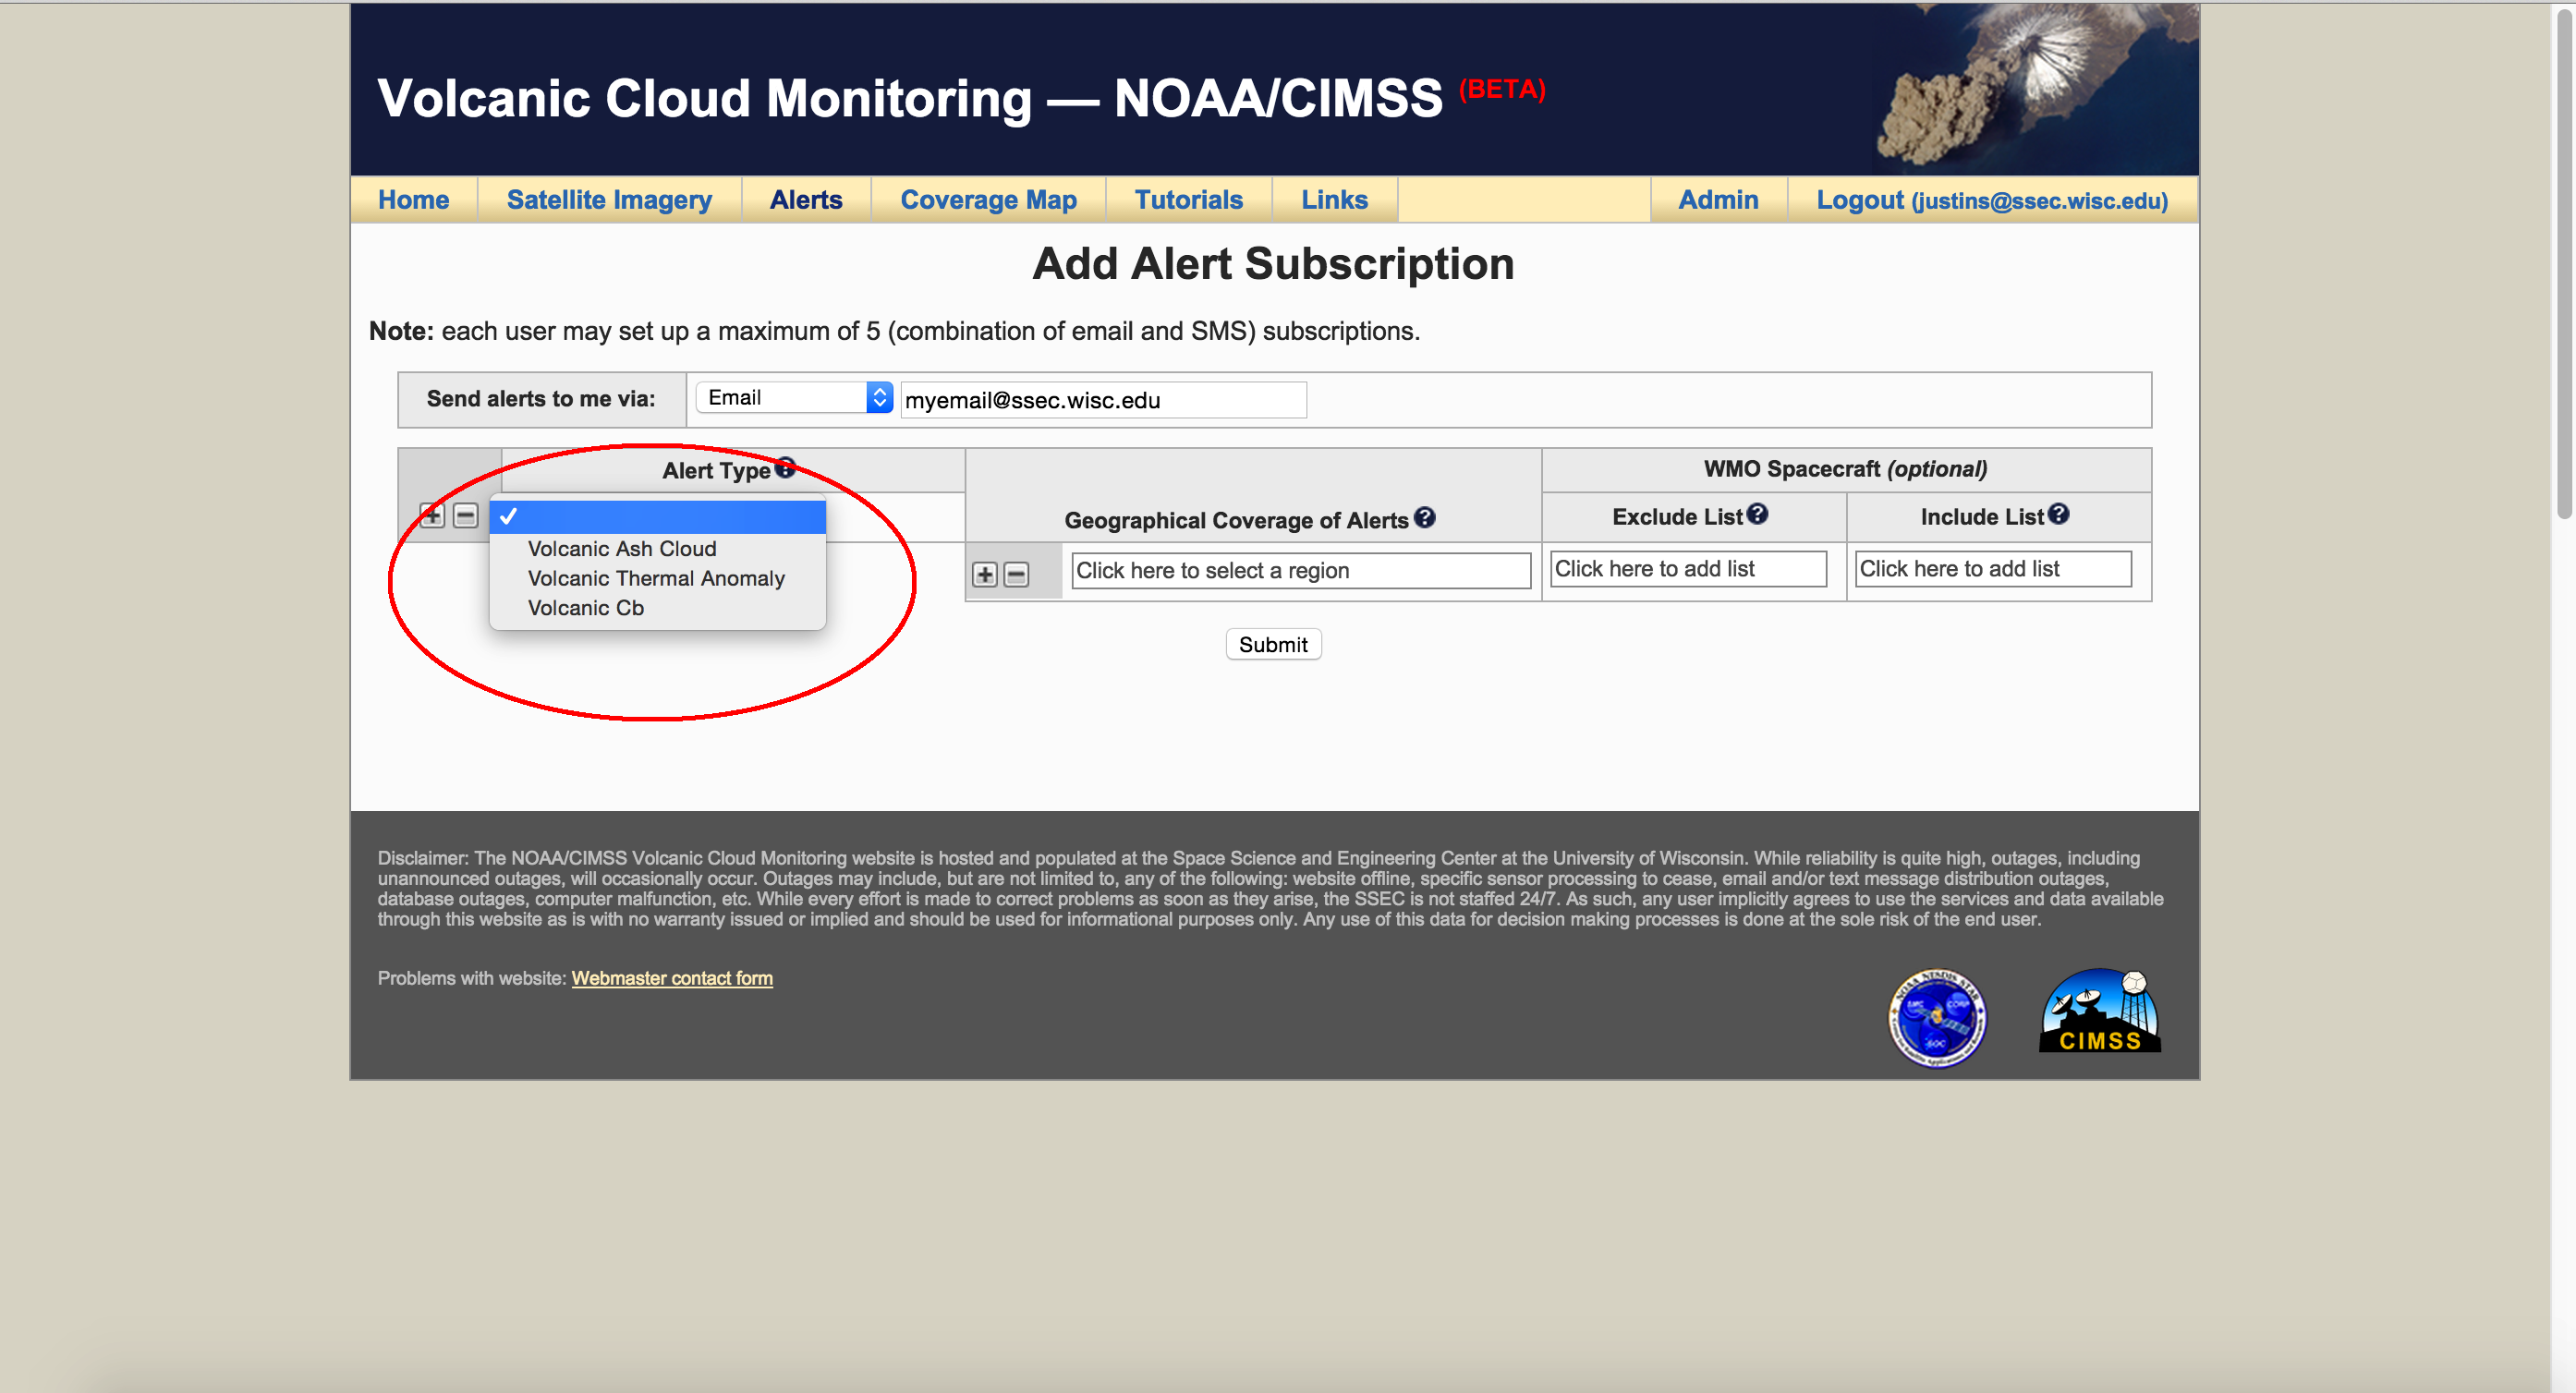
6) The second step is to select the "Alert Type" (Volcanic Ash Cloud, Volcanic Thermal Anomaly, or Volcanic Cb). For any subscription you may add any number of alert types--even multiple of the same type with different geographical and/or sensor customization (described in the following steps). The alert type selection is required.
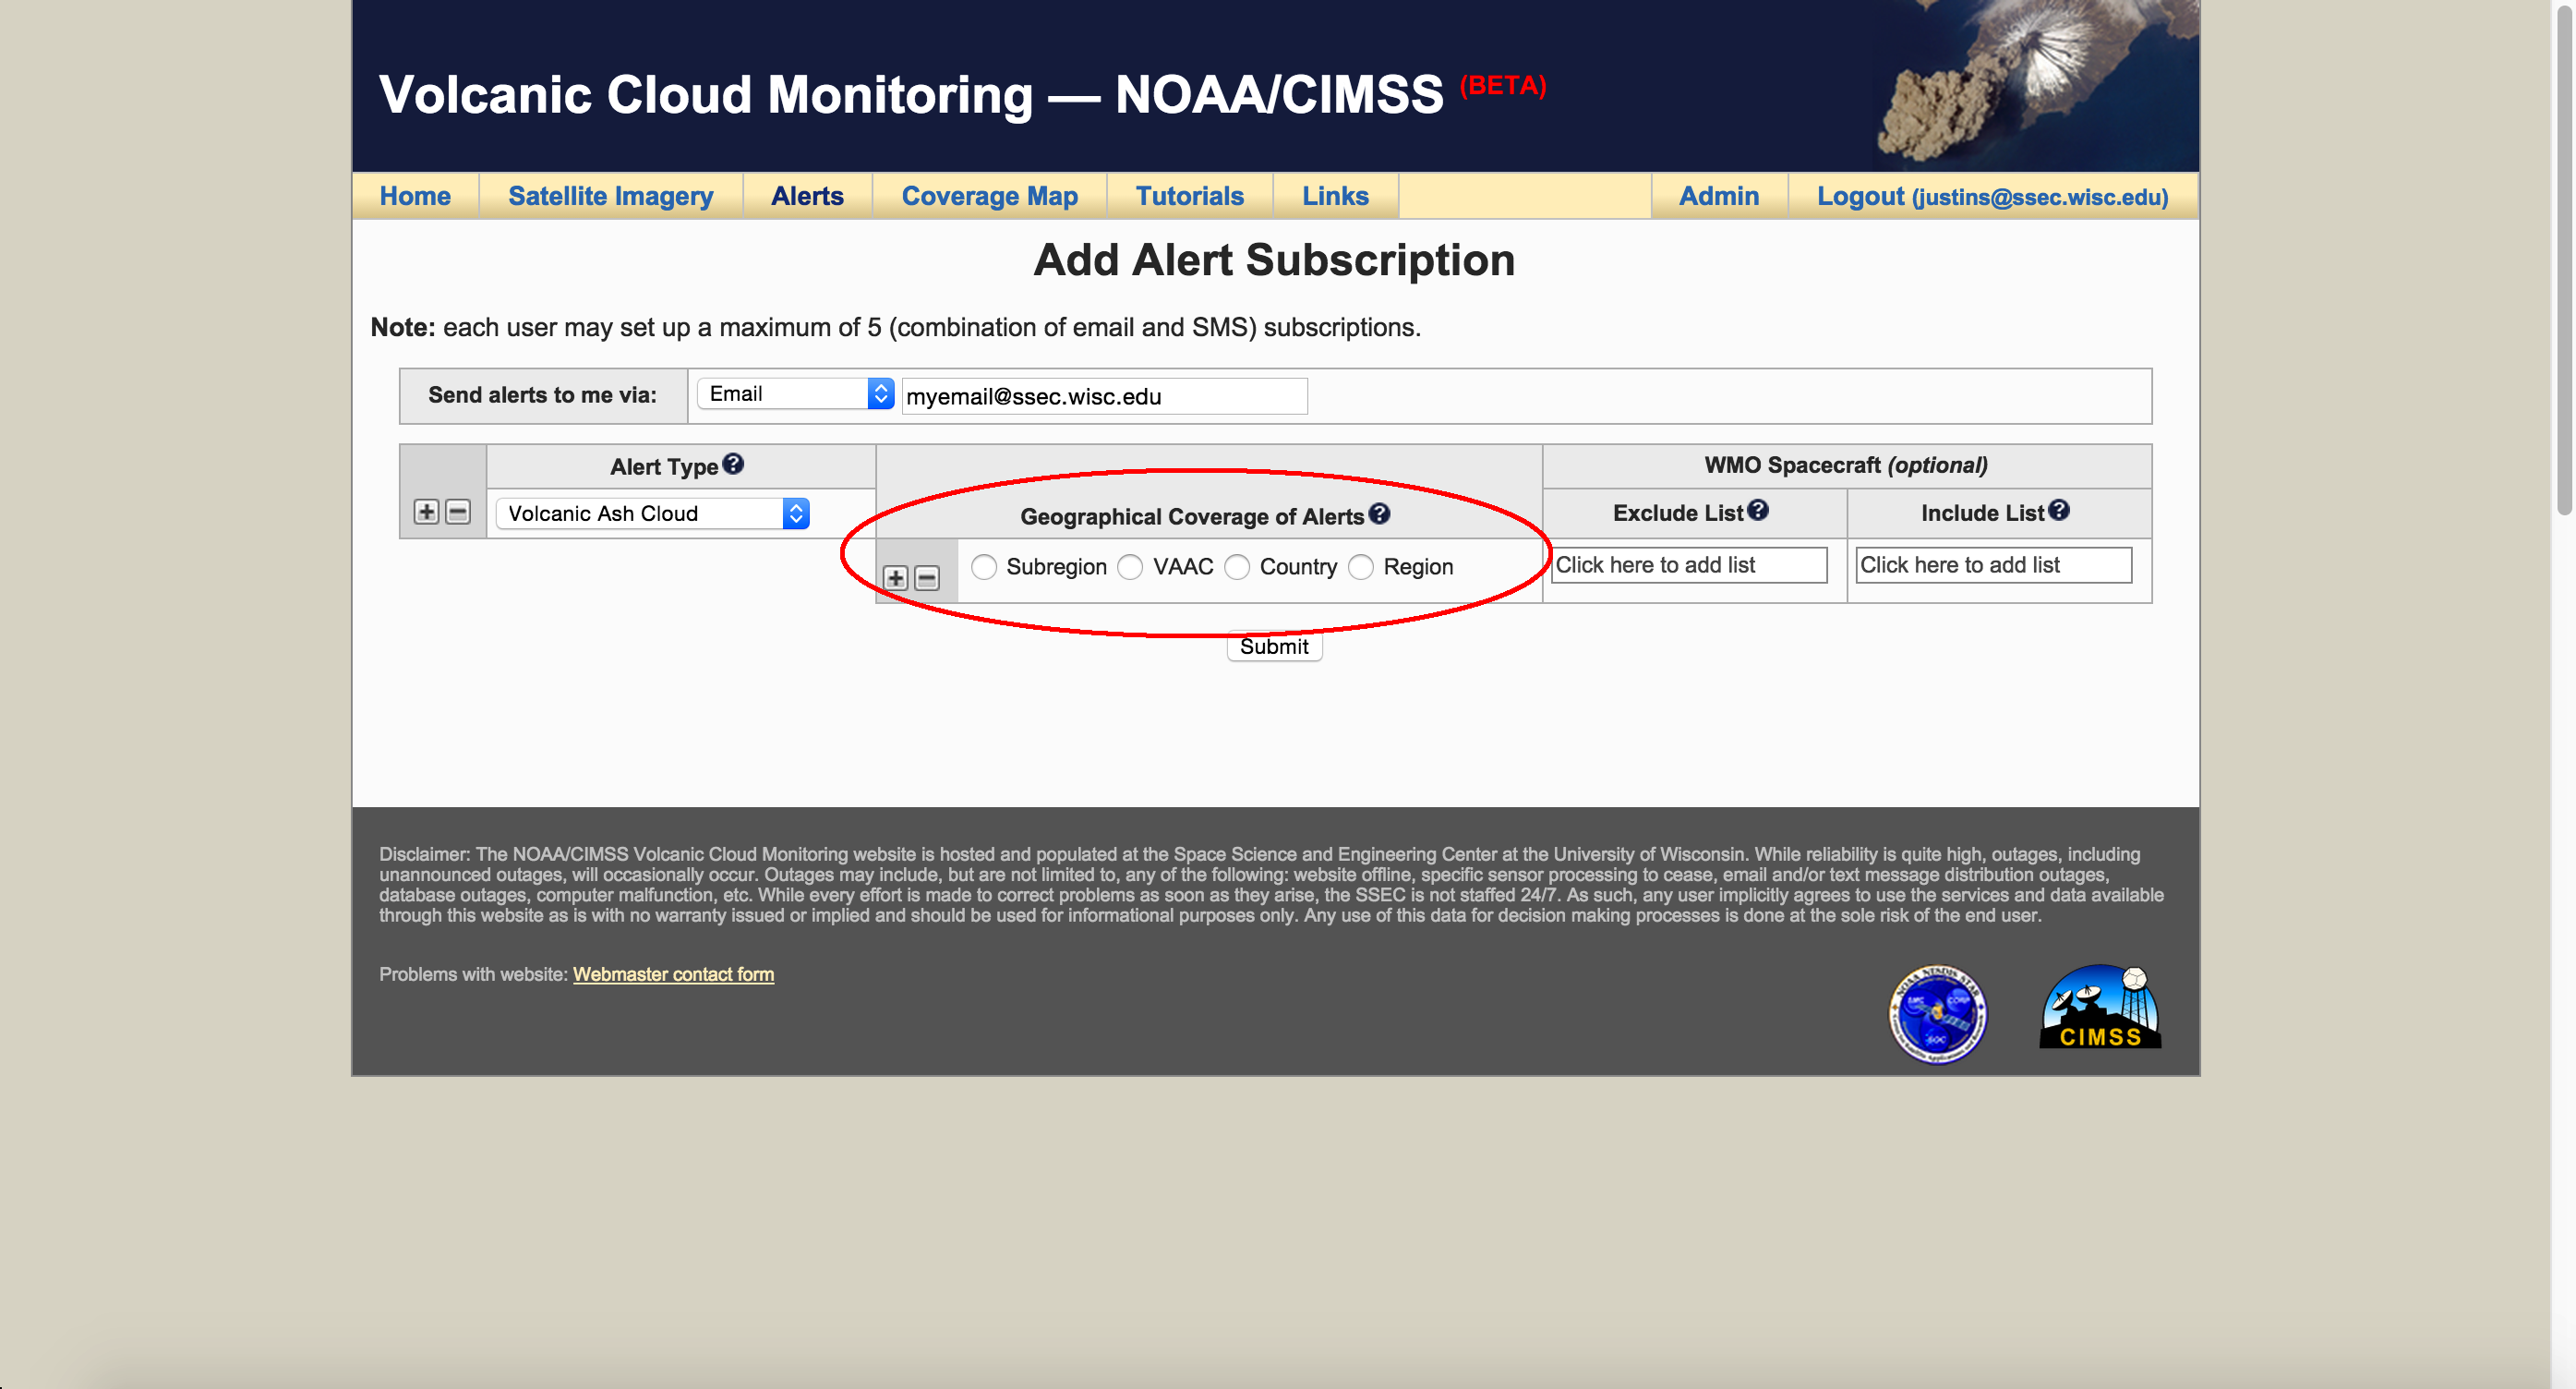
7) For the alert type you selected, now select the Geographic Coverage of Alerts, by VAAC region, country, subregion, or region. The geographical selection is required.
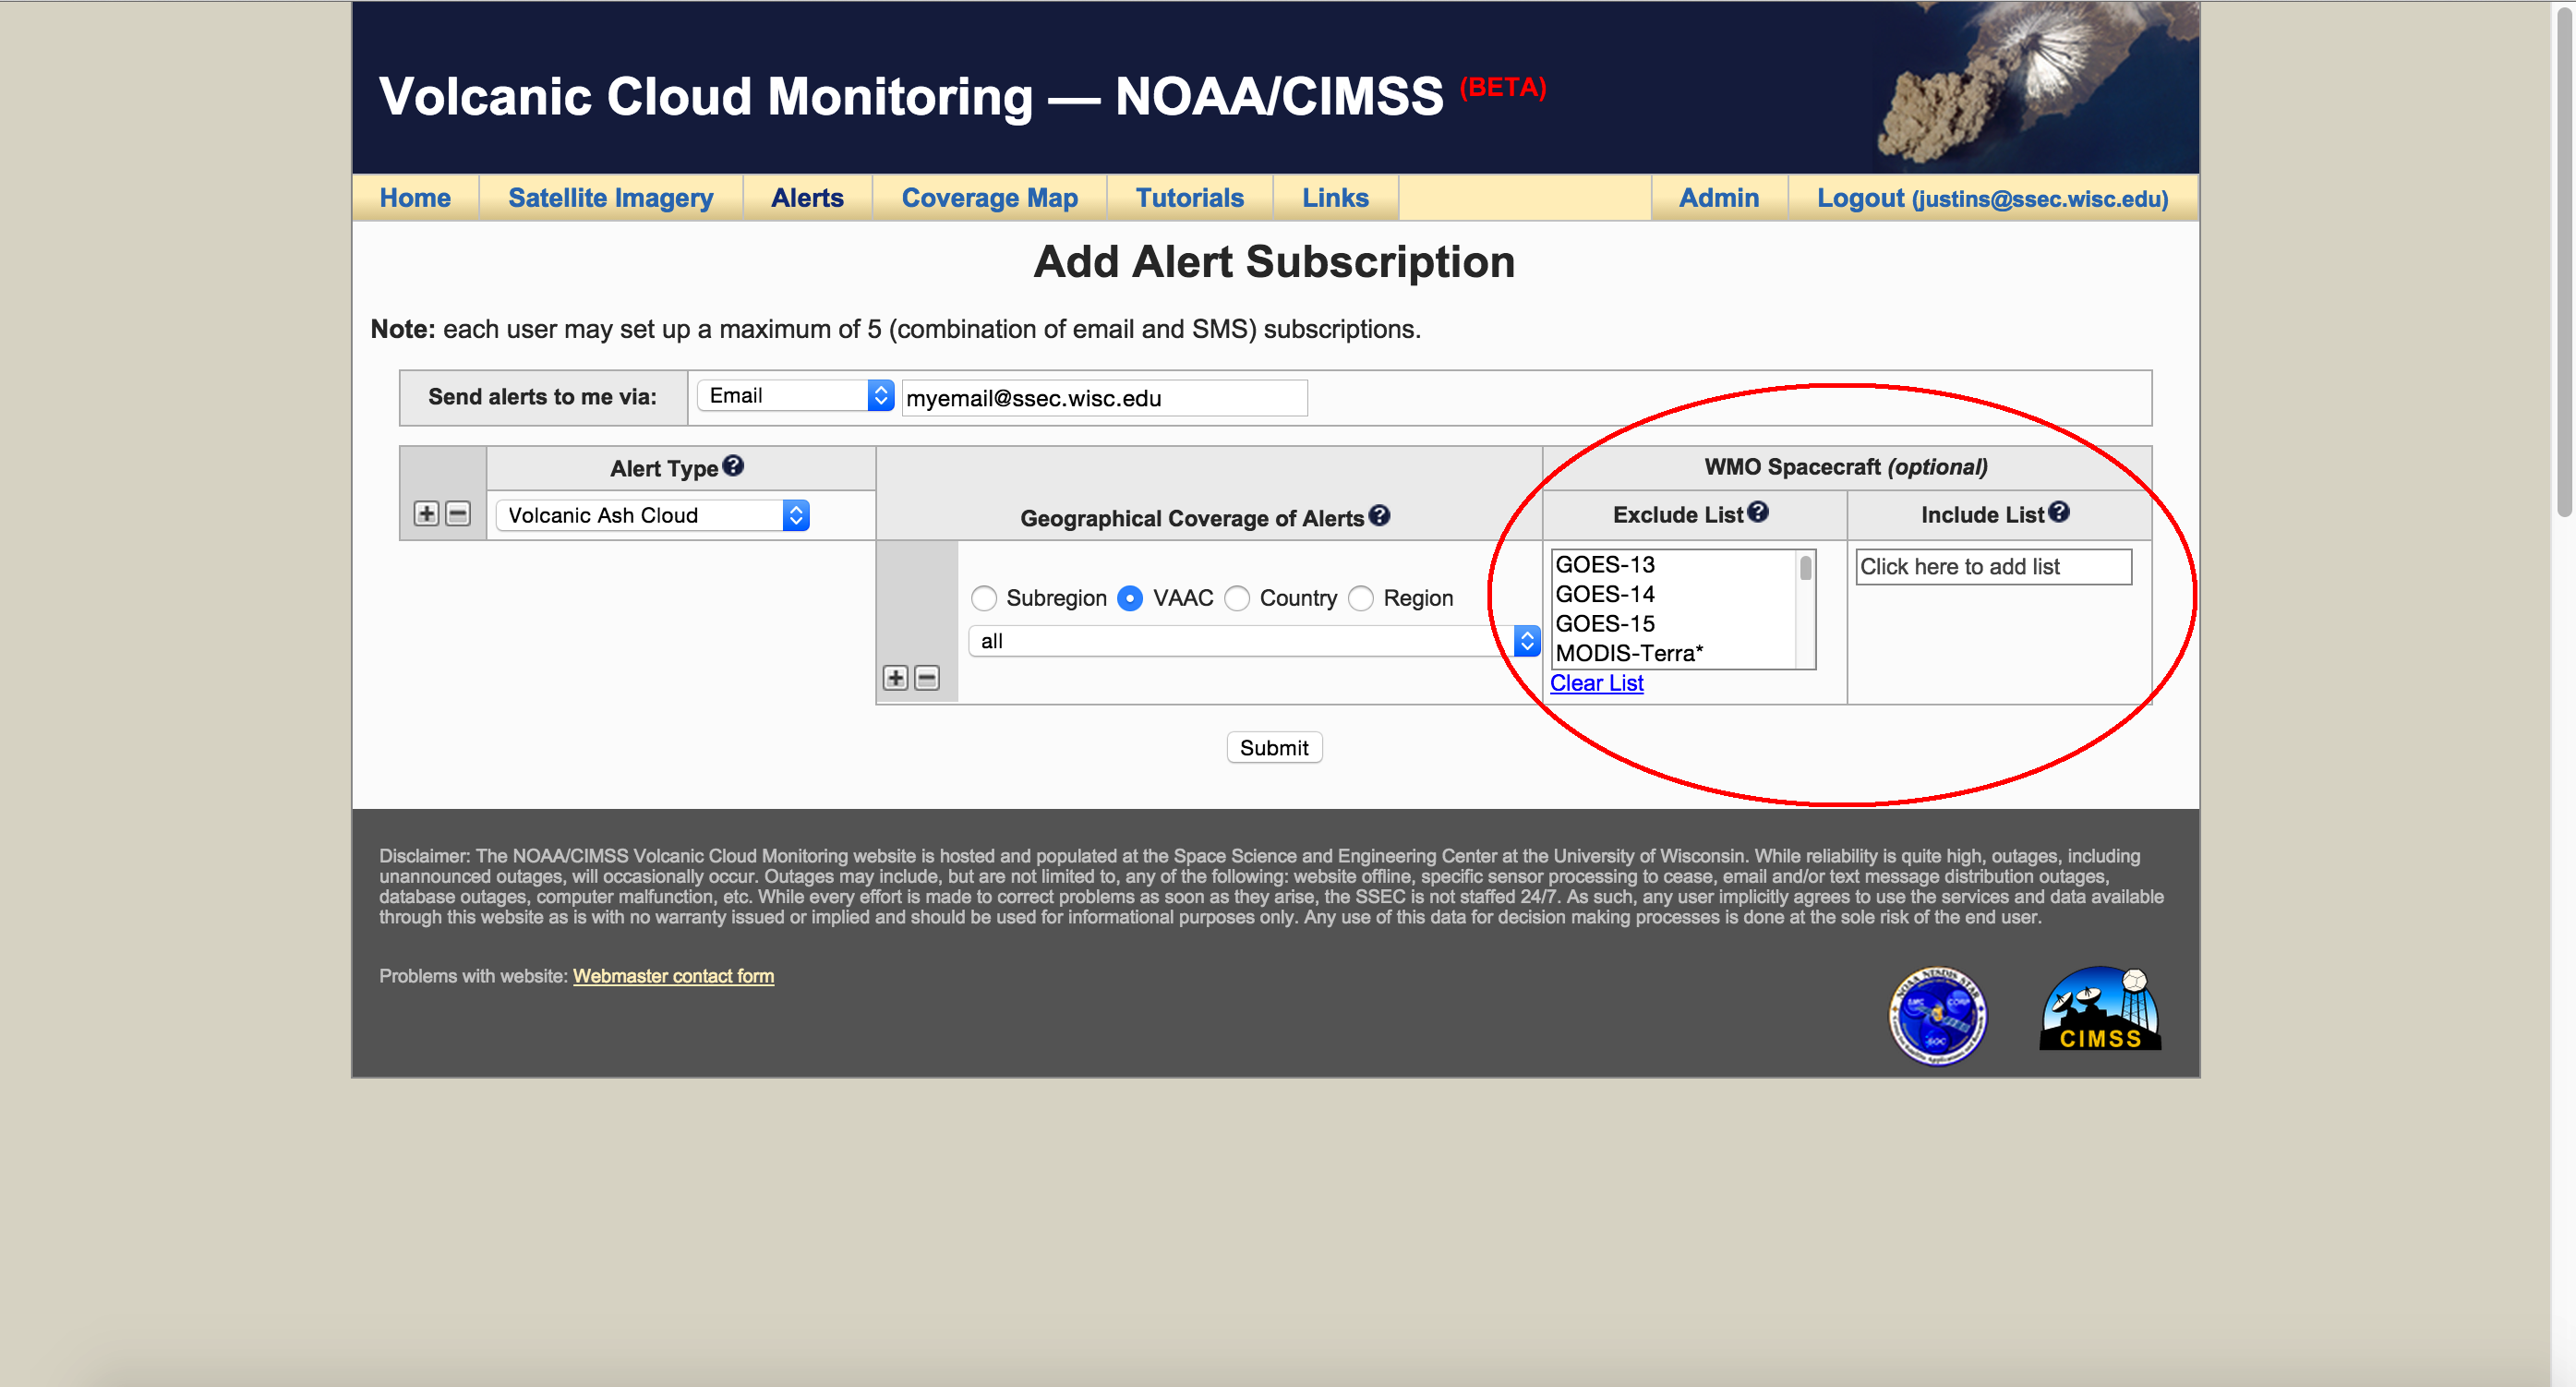
8) Optionally you may select specific sensors to be excluded (e.g.--you may only want LEO alerts, so you may exclude GEO satellites). You may also optionally select specific sensors to always be included. (The include list is limited to LEO sensors only--as a user may want an alert every time a LEO satellite passes over an ash cloud. Given the frequent sampling of GEO sensors, these sensors are omitted from the include list.)
9) To add additional alert types and/or geographical regions with unique subscription options, click the "+" button by "Alert Type" or "Geographical Coverage of Alerts". Once you have added your subscription options, simply click the "Submit" button.
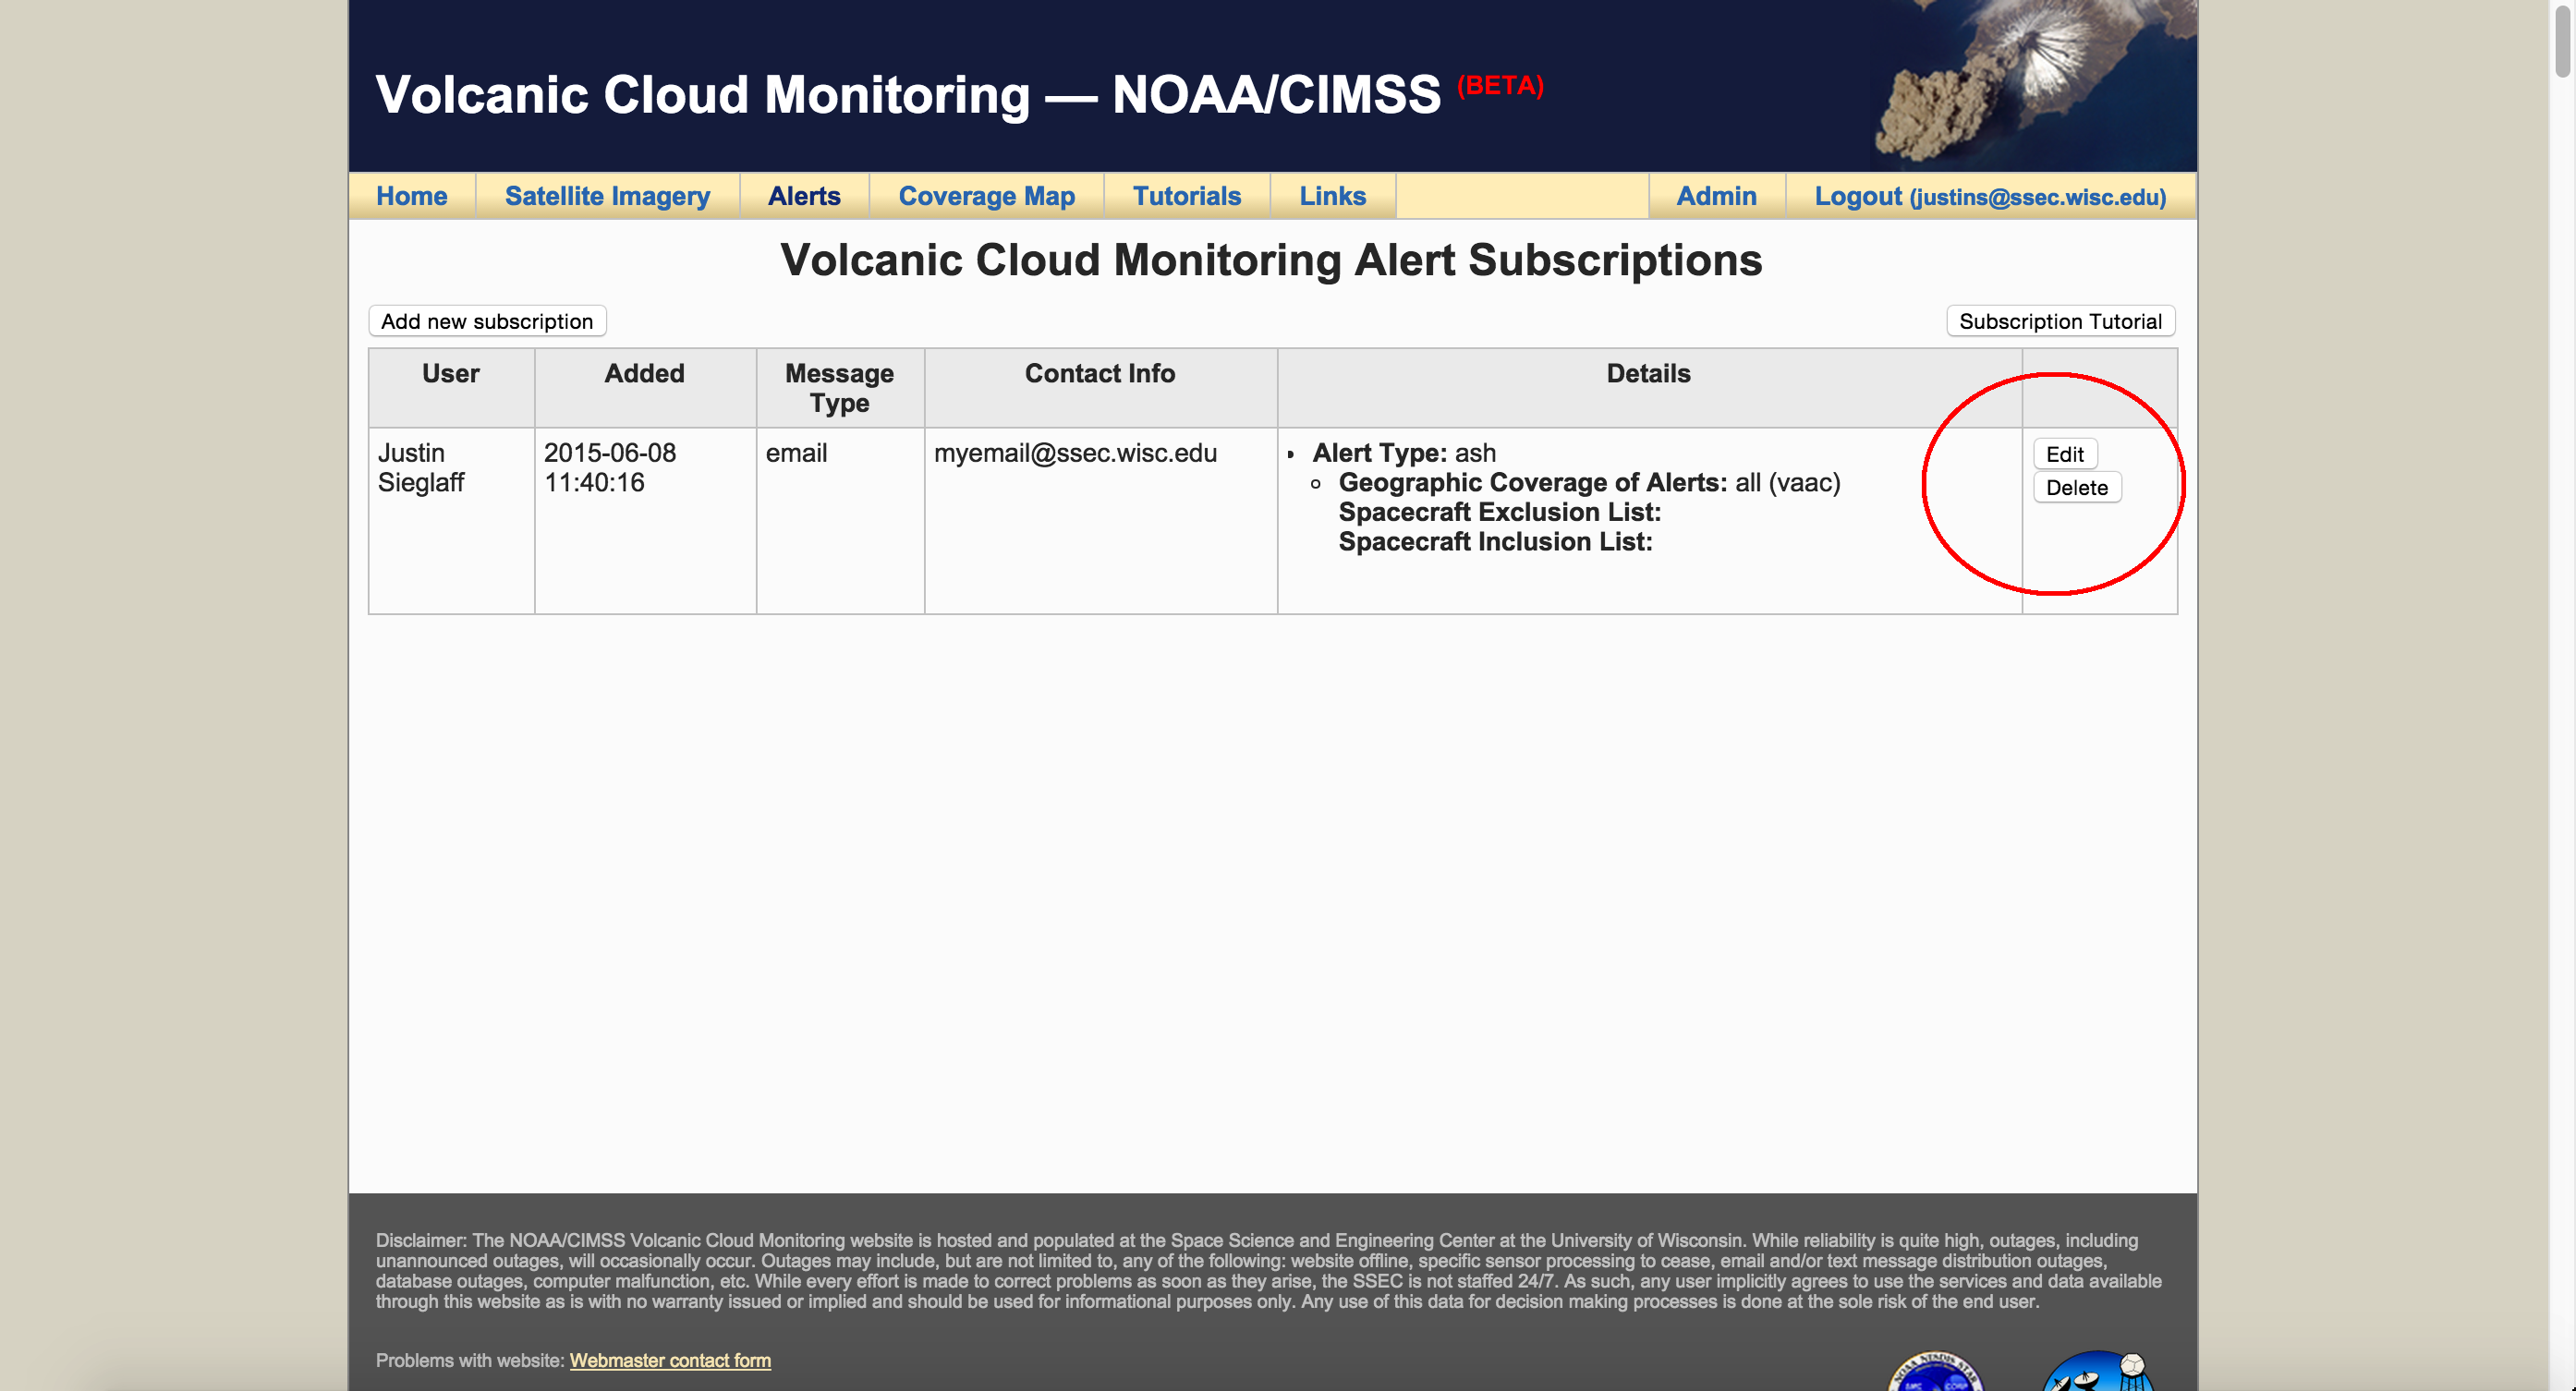
10) After you have added a subscription you may edit any subscription by simply clicking the "Edit" button next to that subscription. Note new subscriptions or subscription edits will take 30-60 minutes to become active.