Meteorological Satellite Monitoring of Kilauea – May 15, 2018
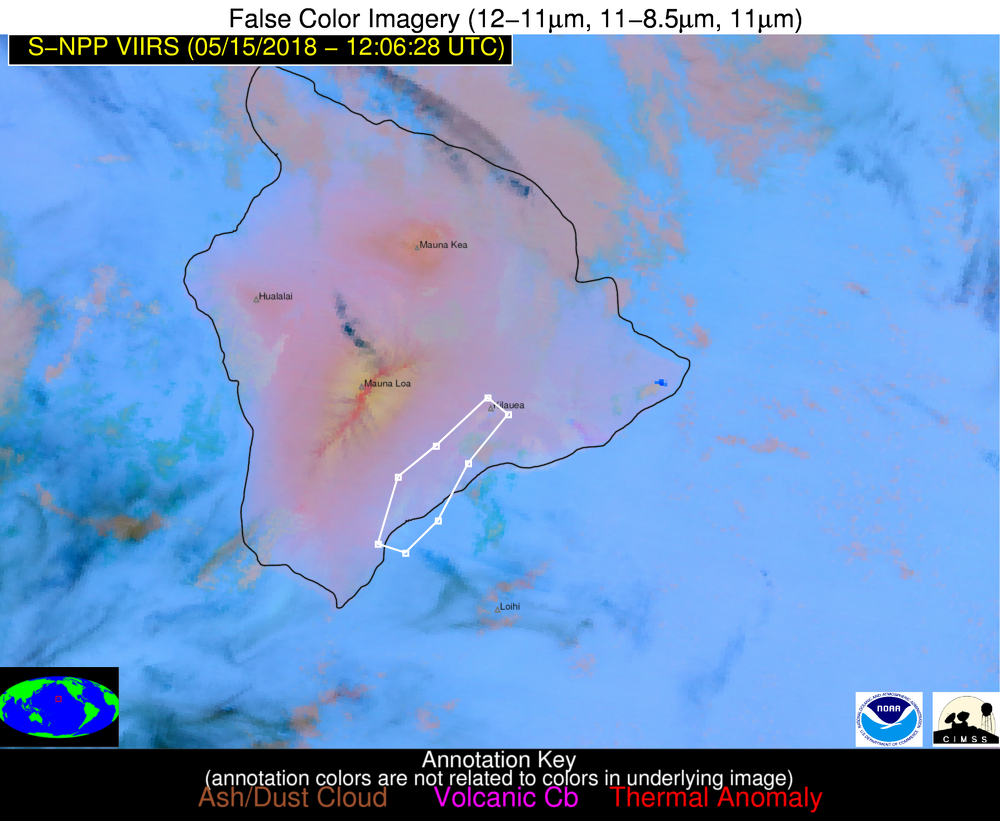
Clouds have prevented satellite detection of SO2 and ash emissions for much the overnight hours Monday (May 14) night and early morning hours on Tuesday (May 15) (local time). A S-NPP overpass at 1206 UTC 15 May 2018 provided a higher spatial resolution view of the situation. Compared to the previous day, less SO2 was evident in S-NPP VIIRS false color imagery. However, a faint SO2 signal can be seen extending from the Kilauea summit to the south-southwest and is highlighted in the ash/dust/SO2 RGB image below. It should be noted, that a lack of SO2 signature in imagery does not mean no SO2 is present, rather, the concentration may be below the infrared-based detection limit, which is a strong function of the temperature difference between the SO2 and the background.

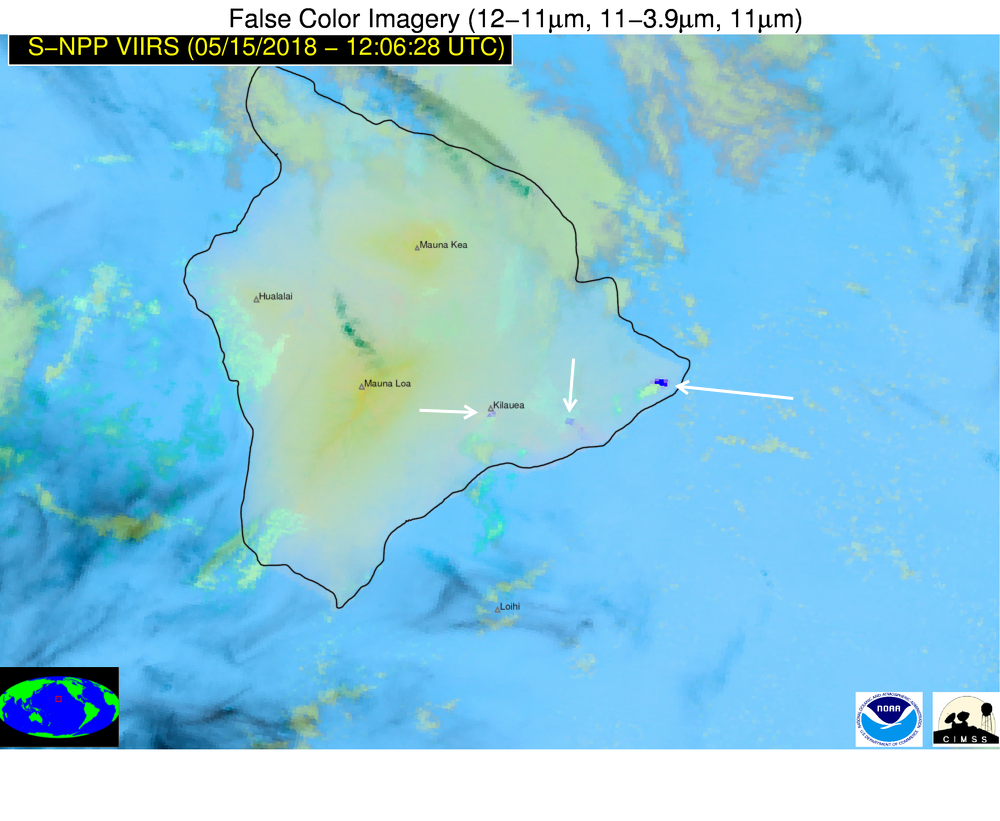
Another relevant type of RGB image can be made by substituting the 3.9 um channel for the 8.6 um channel. This type of RGB is useful for seeing ash plumes and strong positive surface temperature anomalies associated with lava. In the S-NPP VIIRS image below, the dark purple spots, highlighted by white arrows, are a result of very high surface temperatures. The western most arrow is the Kilauea summit, the center arrow is the Pu‘u ‘Ō‘ō crater, and eastern most arrow is lava emerging from fissures in the Lower East Rift Zone. The 3.9 µm channel, owing to the highly non-linear relationship between temperature and emitted radiation at this wavelength, is critical for detecting positive surface temperature anomalies.

An animation of Himawari-8 AHI ash/dustSO2 RGB imagery shows the abundance of meteorological clouds that were present overnight on Monday (May 14) and on Tuesday (May 15) morning. With much coarser spatial resolution (compounded by the oblique viewing angle of Hawaii), the faint SO2 plume visible on the 1206 UTC S-NPP overpass is not unambiguously distinguishable with Himawari-8 imagery. This serves as a good example of how geostationary and polar orbiting satellites can be used in tandem for volcanic hazard monitoring.
Lastly, of interest is the Himawari-8 Ash/SO2 RGB imagery loop (below) of a small ash plume from the Kilauea summit during the morning into the afternoon of 14 May 2018 (local time). Ash emissions occurred in the 1820 – 1940 UTC period and were advected south-southwest. Being a faint feature, use of the 10-minute refresh of Himawari-8 makes the plume more easily identifiable. At 2100 UTC the plume is located from near Pahala, Hawaii to offshore areas east of the southern tip of the Big Island (faint pink-brown feature in the imagery). The plume continued to slowly move south-southwest reaching offshore regions south-southwest of the southern tip of the Big Island by the end of the loop. Identification of ash plumes in false color imagery is discussed in a separate post. False color images, like the one shown below, are available in near real-time on the VOLcanic Cloud Analysis Toolkit website.