Meteorological Satellite Monitoring of Kilauea – May 14, 2018
The eruption of the Kilauea volcano continued on May 14, 2018, resulting in lava flows and enhanced sulfur dioxide (SO2) emissions. Clouds of SO2 can be hazardous to human health. Geostationary (GEO) and low earth orbiting (LEO) meteorological satellites (e.g., GOES-15, Himawari-8, and S-NPP) can be useful for identifying positive surface temperature anomalies associated with the presence of lava and for identifying and characterizing clouds produced by volcanic eruptions. GEO satellites provide more frequent images (every 10-15 minutes), while LEO satellites provide higher spatial resolution imagery and/or better coverage of the electromagnetic spectrum. Thus, GEO and LEO meteorological satellites should be used in tandem for volcanic hazard monitoring (and most other satellite remote sensing problems). The following satellite images from May 14, 2018 help illustrate how meteorological satellites can complement other sources of information (e.g. ground and aircraft) for monitoring the ongoing eruption of Kilauea.
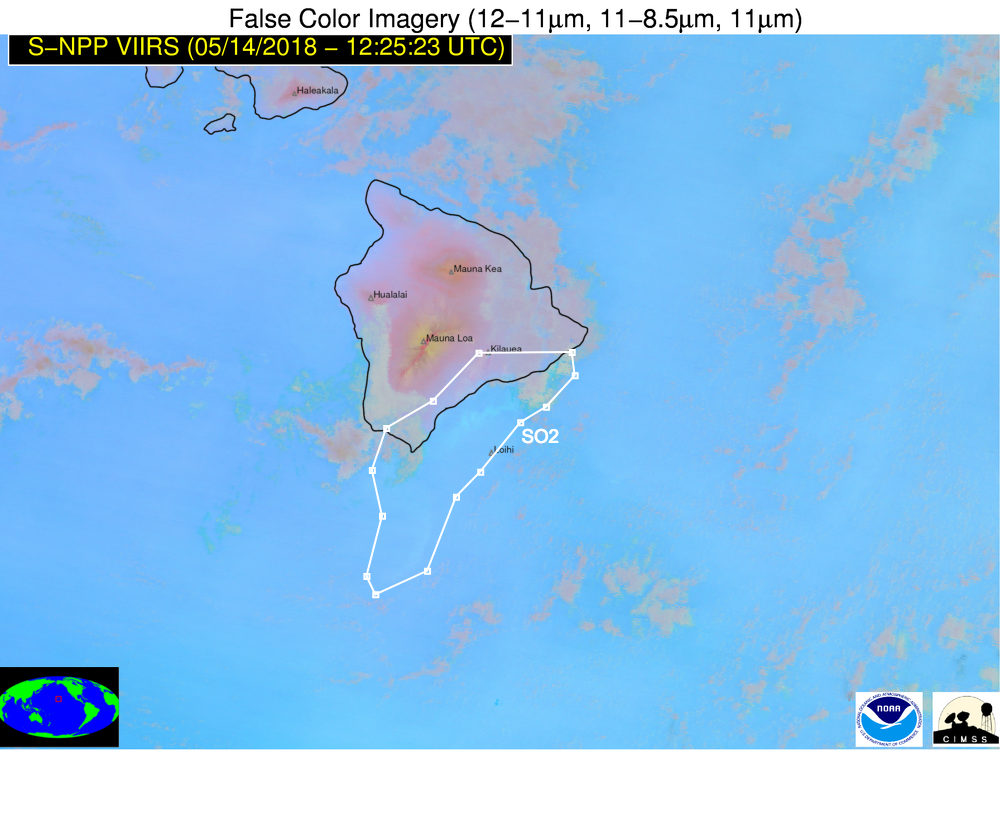
The S-NPP VIIRS image below is able to highlight some of the Kilauea SO2 emissions on May 14, 2018. SO2 is a selective absorber/emitter of radiation, which means that only satellite measurements that capture radiation at certain wavelengths or frequencies will be sensitive to the presence of SO2. One of the wavelength ranges that is sensitive to SO2 is centered around 8.6 um. Satellite sensors such as the JPSS VIIRS and Himawari-8 AHI have such spectral bands. In order to use the “8.6 um” channel for SO2 detection, you need to contrast the measurements with an appropriate channel that is not sensitive to SO2. We typically do this by computing the brightness temperature difference (BTD) between 11 and 8.6 um channels. Further value is added if the 11 and 8.6 um BTD is combined with other infrared measurements that are sensitive to ash in a false color (RGB) image. As part of the VOLcanic Cloud Analysis Toolkit (VOLCAT), we utilize the 12-11 um BTD (red), 11 – 8.6 um (green), 11 um BT (blue) RGB, which is sometime called the ash/dust/SO2 RGB (the names of RGB’s can be confusing and are often somewhat arbitrary given that RGB’s are sensitive to so many different features). In such an RGB, SO2 will appear green if present with little to no ash. If a detectable amount of ash is also present, regions of ash + SO2 will appear yellow. In reality, that interpretation greatly oversimplifies the problem, as there are numerous caveats and nuances. For instance, not all SO2 is detectable using this method, especially if the SO2 is close to the ground and/or is present in low concentrations. Meteorological clouds also limit detection. Surface features and other non-volcanic cloud types can also sometimes look similar to SO2 in such false color imagery. Nevertheless, a broad region of SO2 from the Kilauea eruption is identifiable in the VIIRS RGB image with good spatial detail.
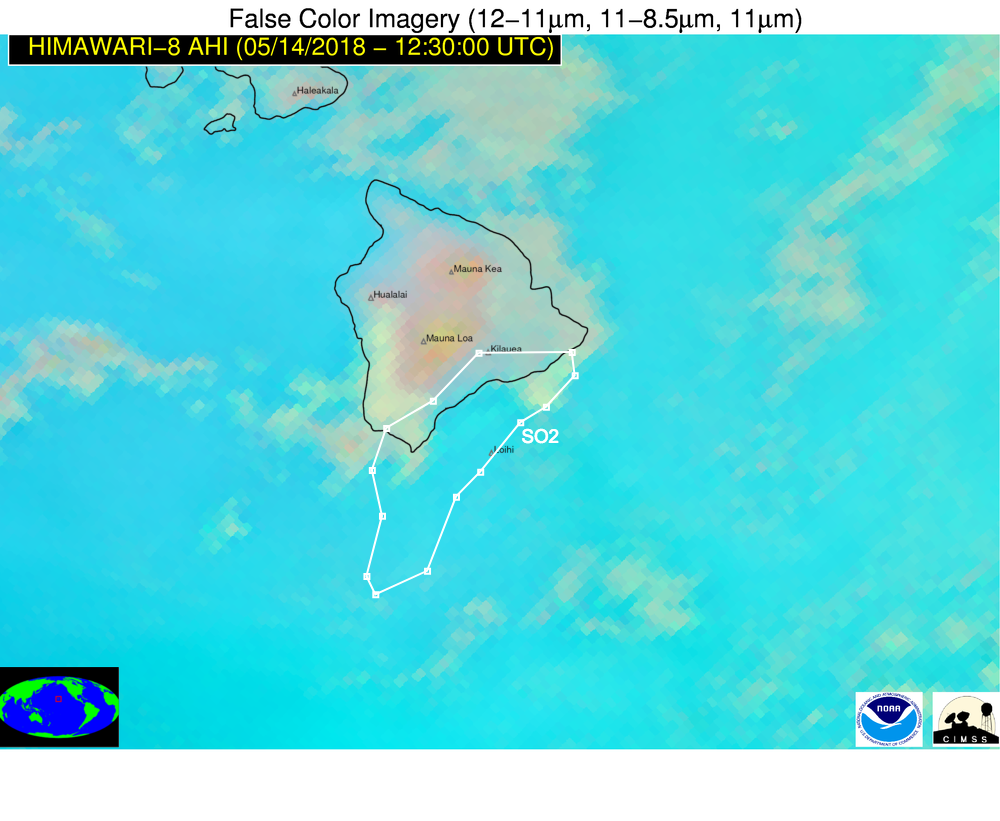
Similar false color imagery can be created with measurements from the Himawari-8 AHI instrument. The image below shows the same SO2 plume depicted by the VIIRS RGB image. Since Himawari-8 is located at 140 East longitude, the view of Hawaii is at a very oblique angle (satellite view angles of near 75 degrees), thereby degrading the spatial resolution and introducing varying degrees of parallax.
In a single Himawari-8 image, it may be difficult to definitively pick out the SO2 plume due to the courser spatial resolution at larger viewing angles. However, if one takes advantage of the high refresh rate of Himawari-8 (every 10 minutes) and creates an animation, the SO2 plume becomes easier to distinguish as one can see the motion of the plume from the East Rift Zone to the southwest (as the low level winds have been blowing from northeast to southwest on Monday). The first loop shows the same domain as the images above and the second loop is more zoomed in.
At the start of the loops the SO2 plume is obscured by higher level cirrus clouds. Around 0800 UTC 14 May 2018, the SO2 plume becomes evident to the southwest of the East Rift Zone (largely over the ocean). Between roughly 8 and 12 UTC, the SO2 plume is clearly visible from the source region to near the southern tip of the Big Island. Notice near the source region, around 12 UTC, stratus clouds are advected in from the northeast, which again obscure the SO2 plume. These stratus clouds continue to push to the southwest, obscuring more of the plume. Finally late in the loop, the stratus clouds dissipate and more SO2 is again seen in the imagery (generally due south of the Kilauea summit).
This example highlights how it is critical to use multiple satellite assets for volcanic cloud monitoring. Specifically, the higher spatial resolution S-NPP VIIRS nicely complements Himawari-8 imagery, which is refreshed every 10 minutes. Once the GOES-17 satellite is moved to the western position later in 2018, satellite-based volcanic cloud monitoring in Hawaii will be further improved.
When using satellite imagery to determine the location and movement of SO2 plumes it is important to remember the following:
- SO2 can be obscured by meteorological clouds (this is seen early and again late in the above animations).
- Non-related surface and cloud features can take on a similar appearance to SO2 in false color satellite imagery.
- Infrared based SO2 detection can be ineffective when the SO2 is very close to the ground and/or is present in relatively low concentrations.
- SO2, especially at large satellite viewing angles (like those for Hawaii using Himawari-8), can be difficult to unambiguously identify. Use of higher spatial resolution LEO data, like from S-NPP VIIRS can add considerable value and enhance the value of GEO imagery.